1 Results
View Results:
Sort by:
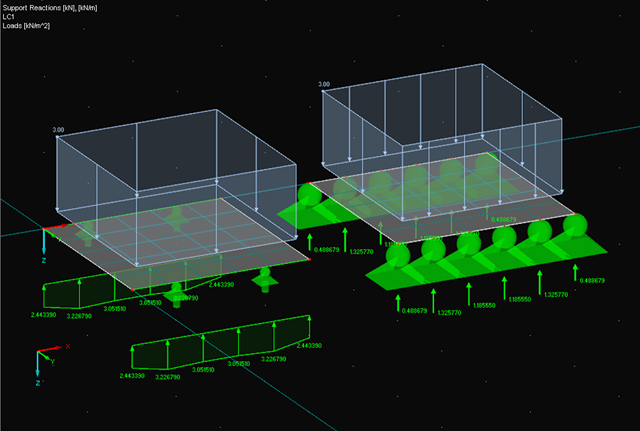
When evaluating line support forces, implausible diagrams sometimes arise at first glance. In particular, for variable loads at locations that also have a nodal support, at division points and edge locations of supported lines, the results sometimes show unexpected support reactions. Using the function of the linear smooth distribution in Project Navigator – Display does not always lead to the expected result diagram.