10 Results
View results:
Sort by:
If you want to consider guide objects in the overall view (F8 key or double-click on the mouse wheel) or, for example, in a particular direction of the views, you can enable this option in the settings of the particular guide objects (guidelines, background layers, line grids).
In the Formula Editor environment, you can specify any parameters (lengths, force values, and so on) to control load and geometry data in the modeling.
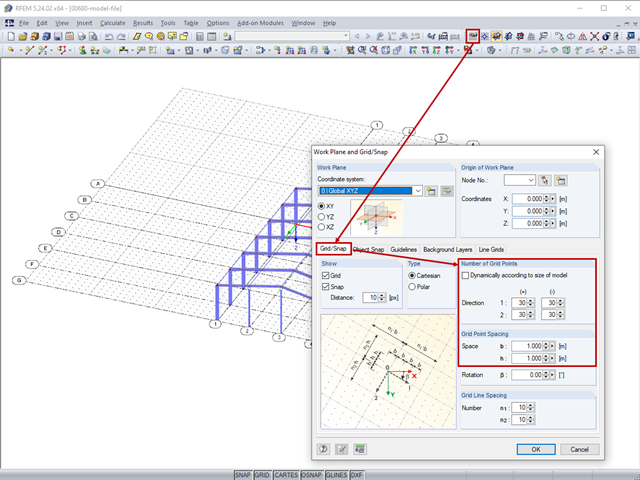
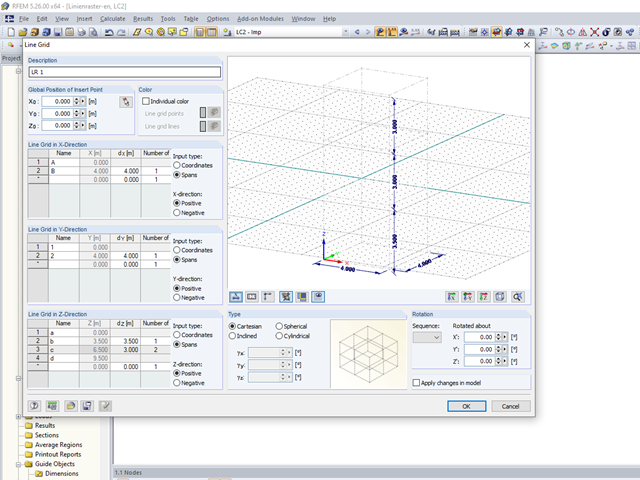
The length of the guidelines corresponds to the dimensions of the set grid and can be adapted by setting the grid.
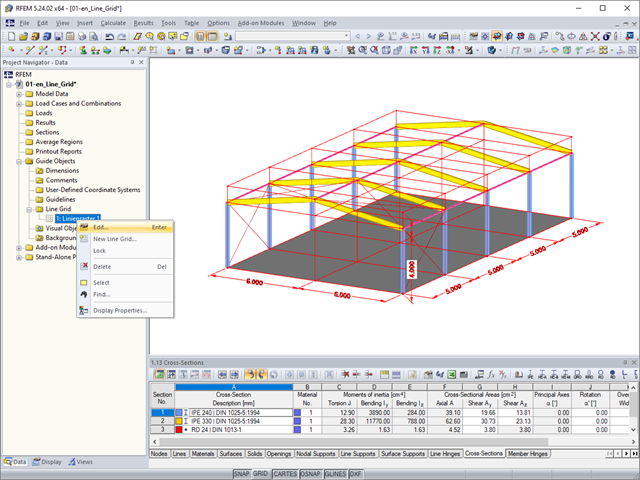
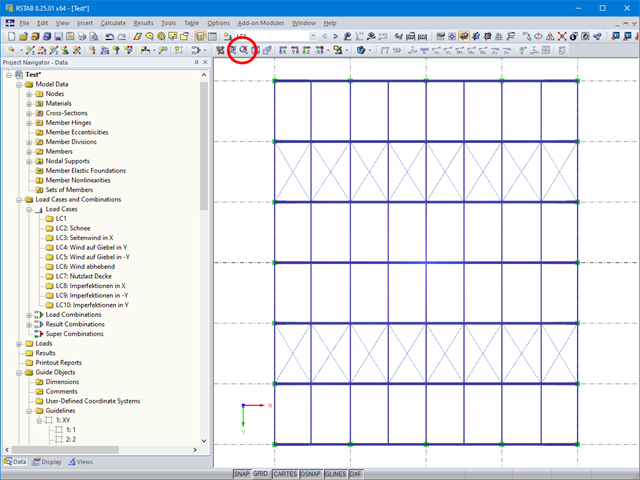
As a quick tool for changing the structure geometry, the "Line Grid" option is available in "Project Navigator – Data" under "Guide Objects".
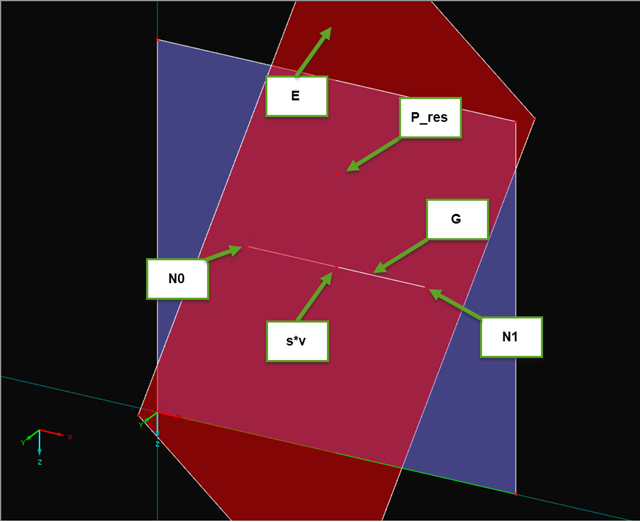
If you read out the results of a surface by means of the COM interface, you get a one-dimensional field with all results at the FE nodes or grid points. To get the results on the edge of a surface or along a line within the surfaces, you have to filter out the results in the area of the line. The following article describes a function for this step.
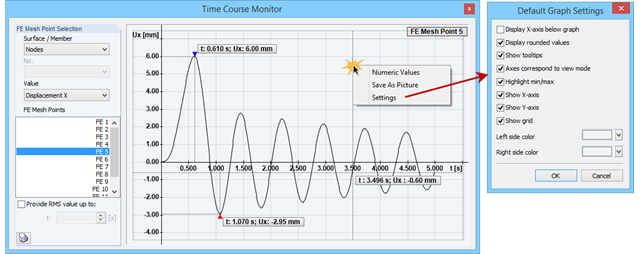
The Time Course Monitor displays the results of a time history analysis from RF‑/DYNAM Pro – Forced Vibrations. The graphic can be adjusted in the settings. This can be reached by right-clicking in the shortcut menu. For example, you can activate or deactivate the grid in the graphic. Those changes are overtaken into the printout report when you print the graphic.
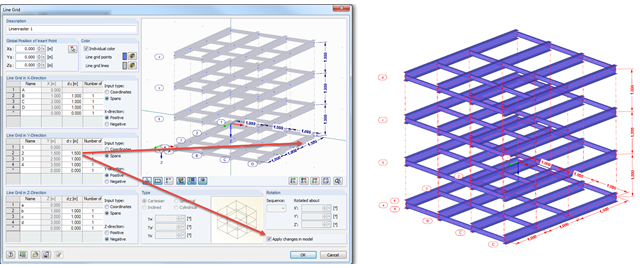
Arranging a model into an axis can provide better visibility, and in addition, the line grid can allow you to apply changes quickly in the model.
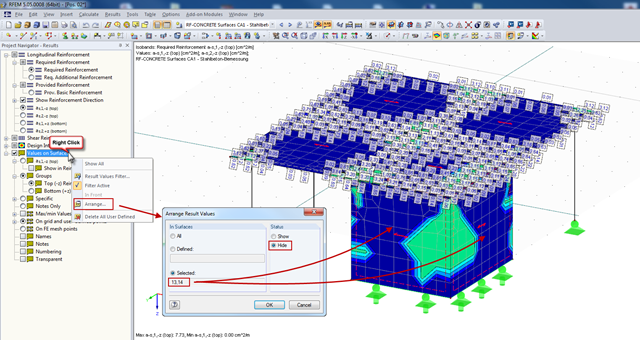
In RFEM, you can display the result values of surfaces (from RF‑CONCRETE Surfaces, for example), which can specify the required reinforcement of the designed surfaces in grid points. Generally, the result values are initially displayed for all surfaces designed.
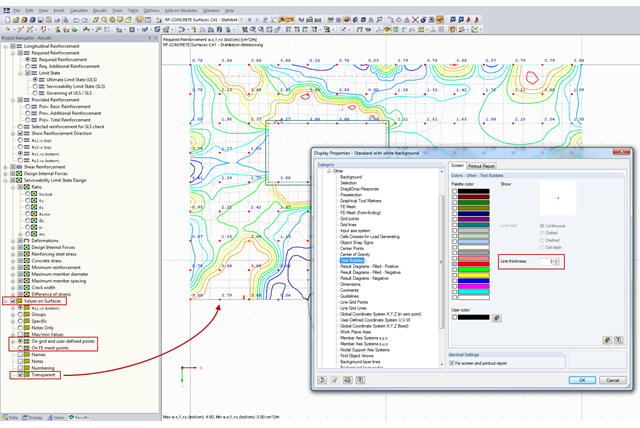
You can document the results of RF‑CONCRETE Surfaces graphically in the printout report. To do this, the "Values on Surfaces" setting is often selected in the Results Navigator of RF‑CONCRETE Surfaces. A text bubble including a result value is displayed, and depending on the settings in the Results Navigator, it can be displayed on the surface grid points, manually defined points, or in FE mesh points.
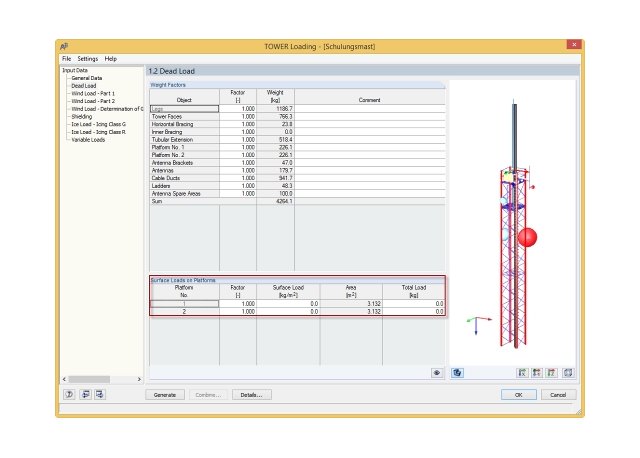
In the RFEM 5.04.0024 and RSTAB 8.04.0024 versions, there is a new feature in RF‑/TOWER Loading that allows you to define additional surface loads in a load case for dead loads; for example, from grids on platforms.