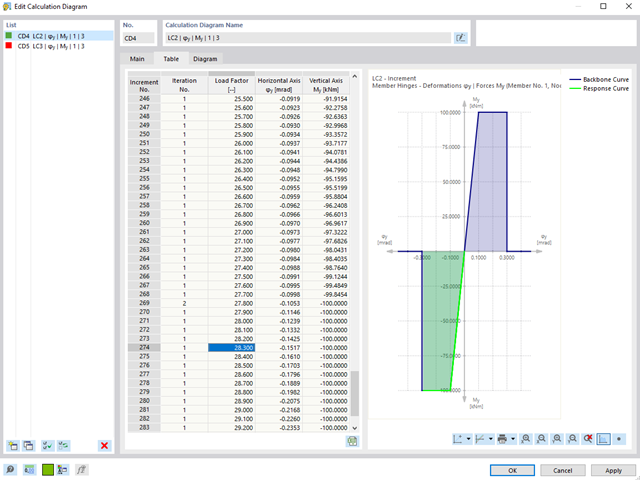
For calculation diagrams, the "2D | Hinge" is available. These hinge diagrams show the hinge response of load situations for nonlinear hinges.
For calculations with several load situations, such as is the case with pushover analyzes and time history analysis, you can evaluate the state of the hinge in each load step.
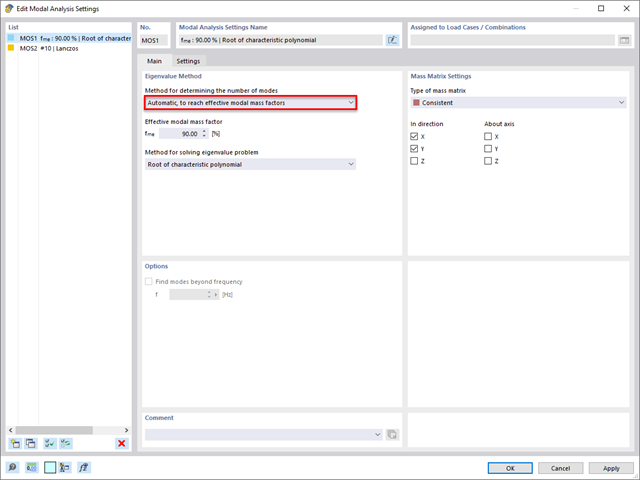
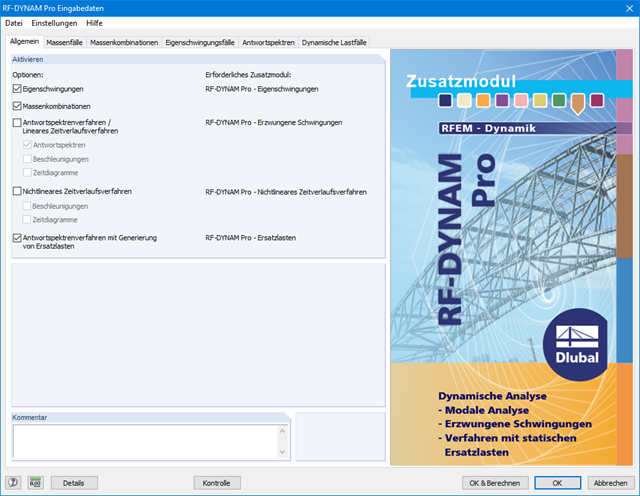
In the Modal Analysis add-on, you have the option to automatically increase the sought eigenvalues until reaching a defined effective modal mass factor. All translational directions activated as masses for the modal analysis are taken into account.
Thus, it is possible to easily calculate the required 90% of the effective modal mass for the response spectrum method.
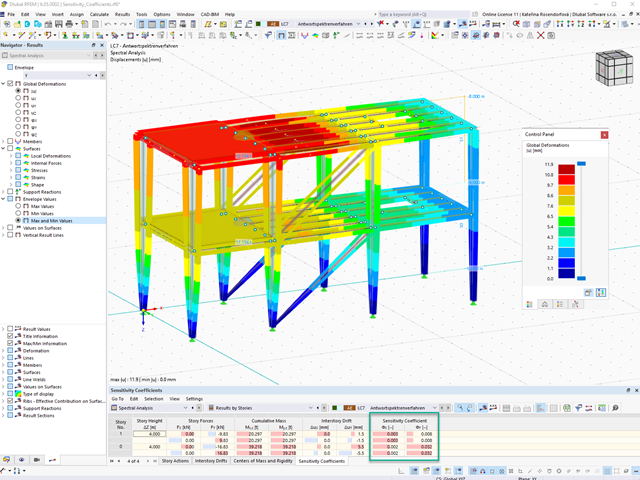
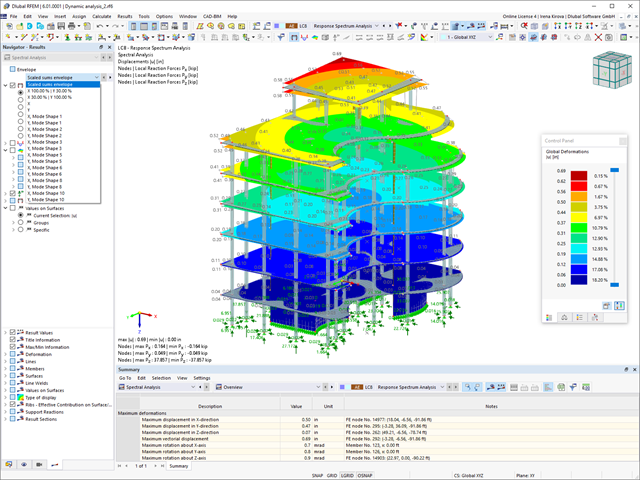
For a response spectrum analysis of building models, you can display the sensitivity coefficients for the horizontal directions by story.
These key figures allow you to interpret the sensitivity to stability effects.
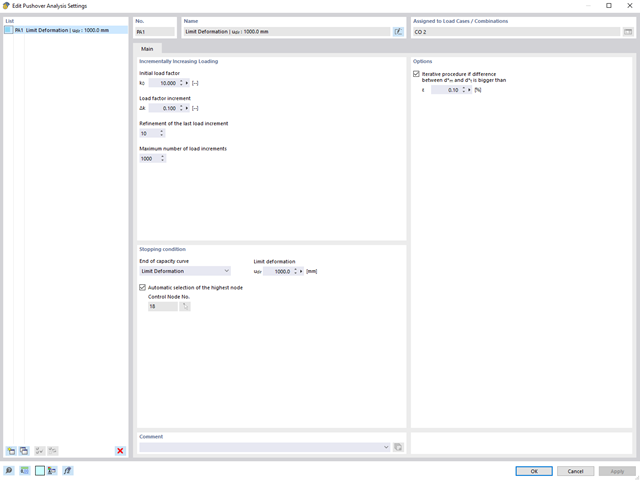
The pushover analysis is managed by a newly introduced analysis type in the load combinations. Here, you have access to the selection of the horizontal load distribution and direction, the selection of a constant load, the selection of the desired response spectrum for the determination of the target displacement, and the pushover analysis settings tailored to the pushover analysis.
In the pushover analysis settings, you can modify the increment of the increasing horizontal load and specify the stopping condition for the analysis. Furthermore, it is possible to easily adjust the precision for the iterative determination of the target displacement.
- Consideration of nonlinear component behavior using plastic standard hinges for steel (FEMA 356, EN 1998‑3) and nonlinear material behavior (masonry, steel - bilinear, user-defined working curves)
- Direct import of masses from load cases or combinations for the application of constant vertical loads
- User-defined specifications for the consideration of horizontal loads (standardized to a mode shape or uniformly distributed over the height of the masses)
- Determination of a pushover curve with selectable limit criterion of the calculation (a collapse or limit deformation)
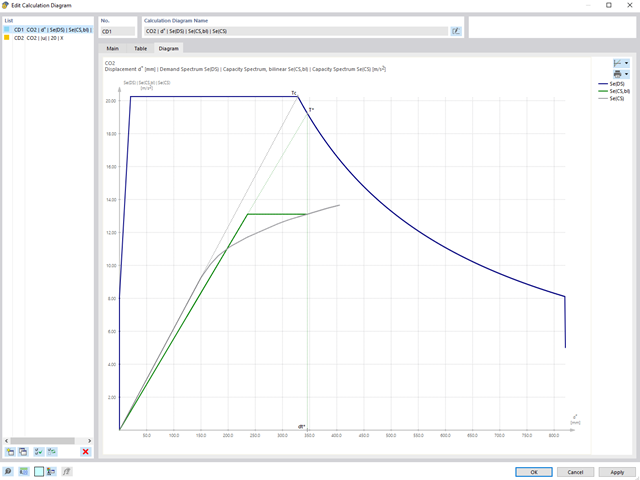
- Transformation of the pushover curve into the capacity spectrum (ADRS format, single degree of freedom system)
- Bilinearization of the capacity spectrum according to EN 1998‑1:2010 + A1:2013
- Transformation of the applied response spectrum into the required spectrum (ADRS format)
- Determination of target displacement according to EC 8 (the N2 method according to Fajfar 2000)
- Graphical comparison of the capacity and required spectrum
- Graphical evaluation of the acceptance criteria of predefined plastic hinges
- Result display of the values used in the iterative calculation of the target displacement
- Access to all results of the structural analysis in the individual load levels
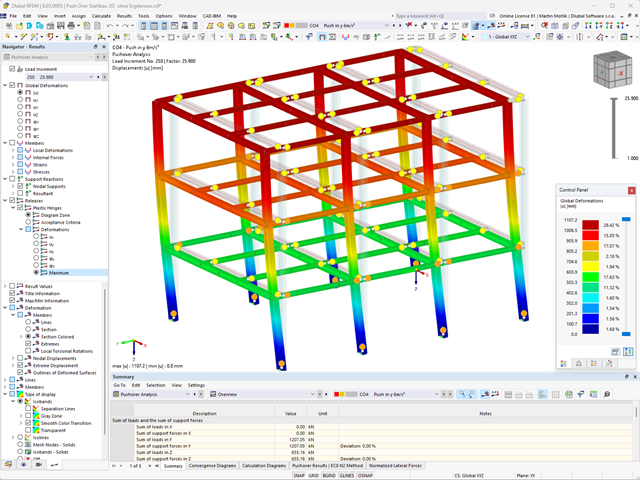
During the calculation, the selected horizontal load is increased in load steps. A static nonlinear analysis is carried out for each load step until reaching the specified limit condition.
The results of the pushover analysis are extensive. On one hand, the structure is analyzed for its deformation behavior. This can be represented by a force-deformation line of the system (a capacity curve). On the other hand, the response spectrum effect can be displayed in the ADRS display (Acceleration-Displacement Response Spectrum). The target displacement is automatically determined in the program based on these two results. The process can be evaluated graphically and in tables.
The individual acceptance criteria can then be graphically evaluated and assessed (for the next load step of the target displacement, but also for all other load steps). The results of the static analysis are also available for the individual load steps.
Compared to the RF-/DYNAM Pro - Equivalent Loads add-on module (RFEM 5 / RSTAB 8), the following new features have been added to the Response Spectrum Analysis add-on for RFEM 6 / RSTAB 9:
- Response spectra of numerous standards (EN 1998, DIN 4149, IBC 2018, and so on)
- User-defined response spectra or those generated from accelerograms
- Direction-relative response spectrum approach
- Results are stored centrally in a load case with underlying levels to ensure clarity
- Accidental torsional actions can be taken into account automatically
- Automatic combinations of seismic loads with the other load cases for use in an accidental design situation
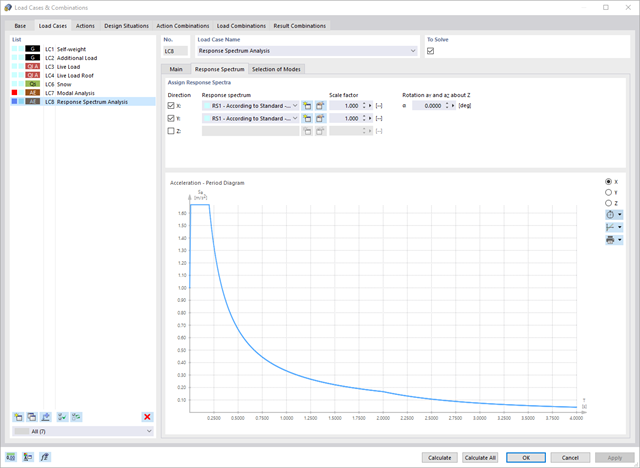
The Dlubal structural analysis software does a lot of work for you. The input parameters, which are relevant for the selected standards, are suggested by the program in accordance with the rules. Furthermore, you can enter response spectra manually.
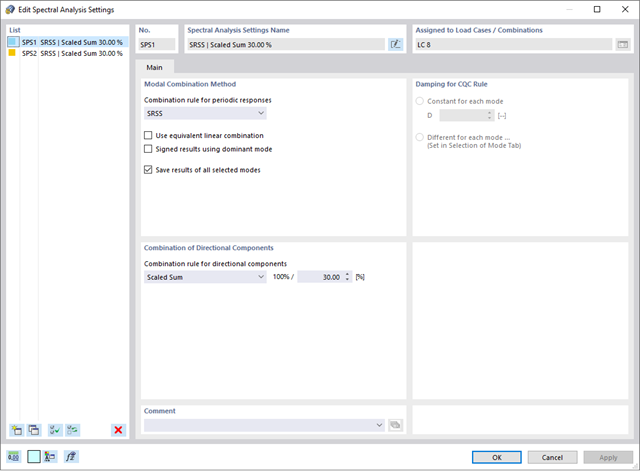
Load cases of the type Response Spectrum Analysis define the direction in which response spectra act and which eigenvalues of the structure are relevant for the analysis. In the spectral analysis settings, you can define details for the combination rules, damping (if applicable), and zero-period acceleration (ZPA).
Did you know that Equivalent static loads are generated separately for each relevant eigenvalue and excitation direction. These loads are saved in a load case of the Response Spectrum Analysis type and RFEM/RSTAB performs a linear static analysis.
The load cases of the type Response Spectrum Analysis contain the generated equivalent loads. First, the modal contributions have to be superimposed with the SRSS or CQC rule. In this case, you can use the signed results based on the dominant mode shape.
Afterwards, the directional components of earthquake actions are combined with the SRSS or the 100% / 30% rule.
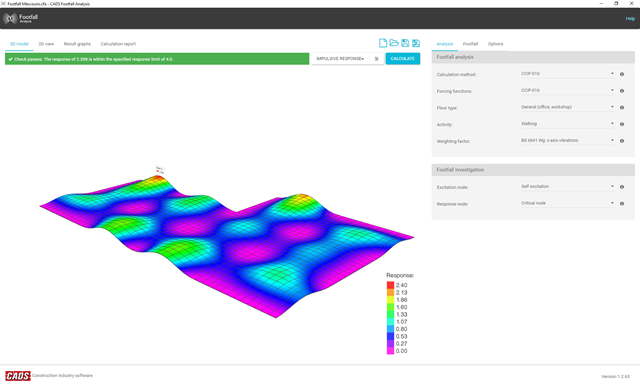
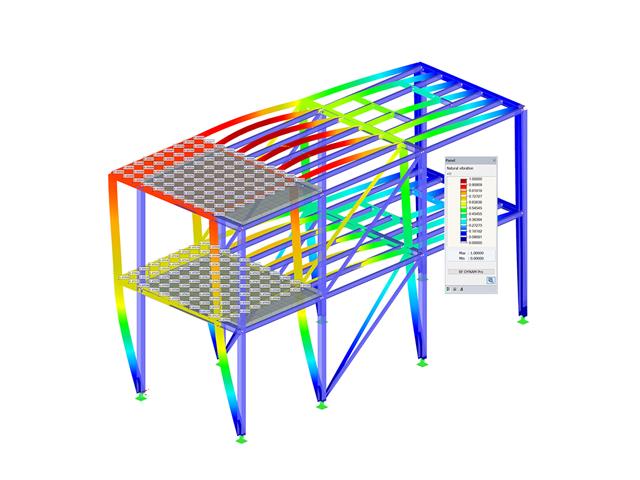
There is a known complexity in calculating footfall response on irregular floors or staircases of any type. Footfall Analysis uses the RFEM model and the modal analysis results of RF-DYNAM Pro - Natural Vibrations to predict the vibration levels at all locations on a floor. A rigorous analysis method is essential to enable an accurate investigation of the dynamic behavior of the floor.
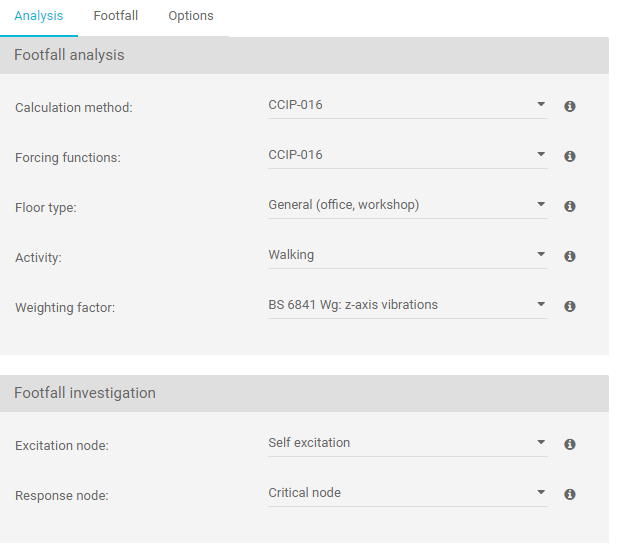
The software incorporates the most up-to-date analysis procedures, allowing the user to select between the two most often used calculation methods available, namely the Concrete Centre Method (CCIP-016) and the Steel Construction Institute Method (P354).
- Footfall Analysis links with RFEM, using the model geometry from there, thus the user is not required to create a second model specifically for footfall analysis
- Allows the user to analyze any type of structure for footfall analysis, irrespective of the shape, material, or use
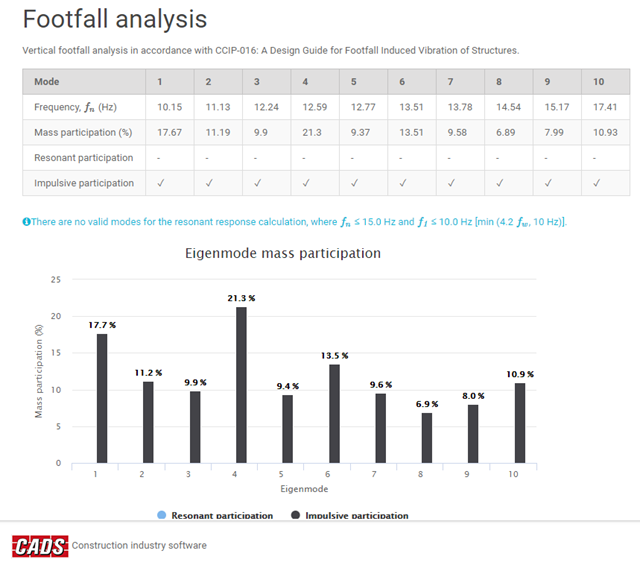
- Quick and accurate predictions of resonant and impulsive (transient) responses
- Cumulative measurement of vibration levels – VDV analysis
- Intuitive output enabling the engineer to advise improvements of critical areas in a cost-effective way
- Pass/fail limit check in accordance with BS 6472 and ISO 10137
- Selection of excitation forces: CCIP-016, SCI P354, AISC DG11 for floors and stairs
- Frequency weighting curves (BS 6841)
- Quick investigation for full model or specific areas
- Vibration Dose Analysis (VDV)
- Adjusting the minimum and maximum walking frequencies as well as the walker’s weight
- User input damping values
- Varying the number of footfalls for resonant response, user input or software calculated
- Environmental response limit based on BS 6472 and ISO 10137
- Overall maximum response factors and critical nodes
- Resonant analysis (maximum response factor, RMS acceleration, critical node, critical frequency)
- Impulsive (transient) analysis (maximum response factor, peak acceleration/velocity, RMS acceleration/velocity, critical node, critical frequency)
- Vibration dose values for both resonant and impulsive analyses
Charts
- Response factor vs walking frequency
- Mass participation vs eigenmodes
- Velocity time history
- Response spectra in accordance with different standards
- The following standards are implemented:
-
 EN 1998-1:2010 + A1:2013 (European Union)
 -
 DIN 4149:1981-04 (Germany)
 -
DIN 4149:2005-04 (Germany)
-
 IBC 2000 (USA)
 -
IBC 2009-ASCE/SEI 7-05 (USA)
-
IBC 2012/15 - ASCE/SEI 7-10 (USA)
-
IBC 2018 - ASCE/SEI 7-16 (USA)
-
 ÖNORM B 4015:2007-02 (Austria)
 -
 NTC 2018 (Italy)
 -
 NCSE-02 (Spain)
 -
 SIA 261/1:2003 (Switzerland)
 -
SIA 261/1:2014 (Switzerland)
-
SIA 261/1: 2020 (Switzerland)
-
 O.G. 23089 + OG 23390 (Turkey)
 -
 SANS 10160-4 2010 (South Africa)
 -
 SBC 301:2007 (Saudi Arabia)
 -
 GB 50011 - 2001 (China)
 -
GB 50011 - 2010 (China)
-
 NBC 2015 (Canada)
 -
 DTR BC 2-48 (Algeria)
 -
DTR RPA99 (Algeria)
-
 CFE Sismo 08 (Mexico)
 -
 CIRSOC 103 (Argentina)
 -
 NSR - 10 (Colombia)
 -
 IS 1893:2002 (India)
 -
 AS1170.4 (Australia)
 -
 NCh 433 1996 (Chile)
-
- The following National Annexes according to EN 1998‑1 are available:
-
DIN EN 1998-1/NA:2011-01 (Germany)
-
ÖNORM EN 1991-1-1:2011-09 (Austria)
-
 NBN - ENV 1998-1-1: 2002 NAD-E/N/F (Belgium)
 -
 ČSN EN 1998-1/NA:2007 (Czech Republic)
 -
 NF EN 1998-1-1/NA:2014-09 (France)
 -
UNI-EN 1991-1-1/NA:2007 (Italy)
-
 NP EN 1998-1/NA:2009 (Portugal)
 -
 SR EN 1998-1/NA:2004 (Romania)
 -
 STN EN 1998-1/NA:2008 (Slovakia)
 -
 SIST EN 1998-1:2005/A101:2006 (Slovenia)
 -
 CYS EN 1998-1/NA:2004 (Cyprus)
 -
 NA to BS EN 1998-1:2004:2008 (United Kingdom)
 - NS-EN 1998-1:2004 + A1:2013/NA:2014 (Norway)
-
- User-defined response spectra
- Direction-relative response spectrum approach
- Relevant mode shapes for the response spectrum can be selected manually or automatically (5% rule from EC 8 can be applied)
- Generated equivalent static loads are exported to load cases, separately for each modal contribution and separately for each direction
- Result combinations by modal superposition (SRSS and CQC rule) and direction superposition (SRSS or 100% / 30% rule)
- Signed results based on the dominant eigenmode can be displayed

- Response spectra of numerous standards (ASCE 7-16, NBC 2015, etc.)
- User-defined response spectra or those generated from accelerograms
- Direction-relative response spectrum approach
- Manual or automatic selection of the relevant mode shapes of response spectra (5% rule of EC 8 applicable)
- Result combinations by modal superimposition (SRSS or CQC rule) and by direction superimposition (SRSS or 100% / 30% rule)
The input parameters relevant for the selected standards are suggested by the program in accordance with the rules. Furthermore, it is possible to enter response spectra manually. Dynamic load cases define a direction of response spectra effects and the structure eigenvalues that are relevant for the analysis.
Due to the integration of RF‑/DYNAM Pro in RFEM / RSTAB, you can incorporate numeric and graphic results from RF‑/DYNAM Pro – Forced Vibrations in the global printout report. Also, all RFEM options are available for a graphical visualization.
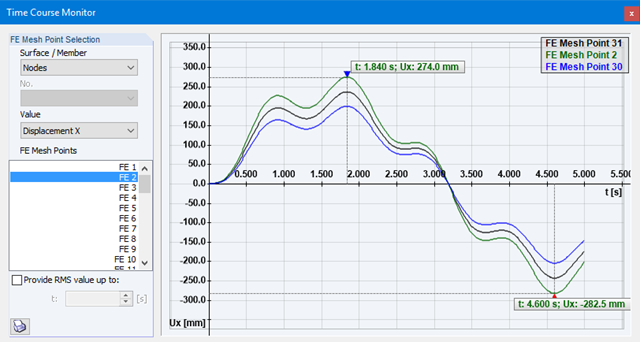
The results of the time history analysis are displayed in a time course monitor. All results are displayed as a function of time. You can export the numeric values to MS Excel.
In the case of a time history analysis, you can export results of the individual time steps or filter most unfavourable results of all time steps.
The response spectrum analysis generates result combinations. Internally, the modal contributions and the directional components of earthquake actions are combined.
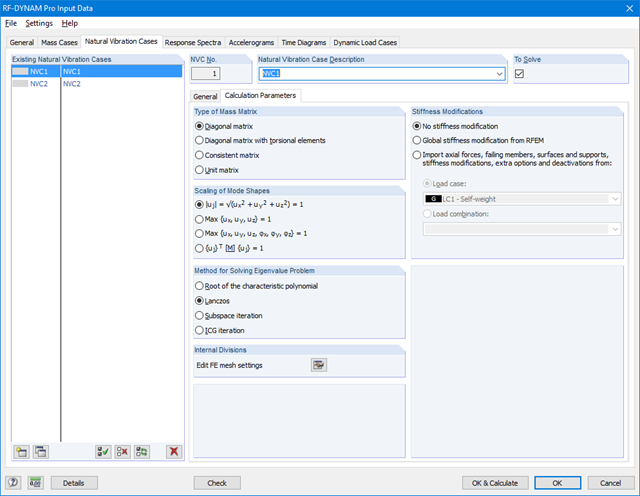
The time history analysis is performed with the modal analysis or the linear implicit Newmark analysis. The time history analysis in this add‑on module is restricted to linear systems. Although the modal analysis represents a fast algorithm, it is necessary to use a certain number of eigenvalues to ensure the required accuracy of results.
The implicit Newmark analysis is a very precise method, independent of the number of eigenvalues used, but requires sufficient small time steps for calculation. For the response spectra analysis, equivalent static loads are calculated internally. A linear static analysis is performed subsequently.
It is necessary to enter the required response spectra, accelerations, or time diagrams. Dynamic load cases define the location and direction of response spectra effects as well as acceleration time, or force-time excitations.
Timing diagrams are combined with static load cases, which provides great flexibility. For the time history analysis, you can import the initial deformation from any load case or load combination.