Description
Existing standards such as EN 1991-1-4 [1], ASCE/SEI 7-16, and NBC 2015, provide wind load parameters, including the wind pressure coefficient (Cp), for basic structural shapes. However, a key challenge lies in determining these parameters more efficiently and accurately, rather than relying on time-consuming and often complex formula-based approaches found in the standards.
One of the key aspects of CFD simulation is selecting accurate and compatible configurations such as the turbulence model, wind velocity profile, turbulence intensity, boundary layer conditions, and the order of discretization. These numerical details, however, are not explicitly specified in EN 1991-1-4.
In the current validation example involving a cylinder structure, we propose a set of recommended CFD settings that are consistent with the Eurocode framework. As outlined in EN 1991-1-4, the determination of Cp values is based on complex formulas that vary with Reynolds number, which can be simplified through well-calibrated CFD approaches.
Analytical Solution
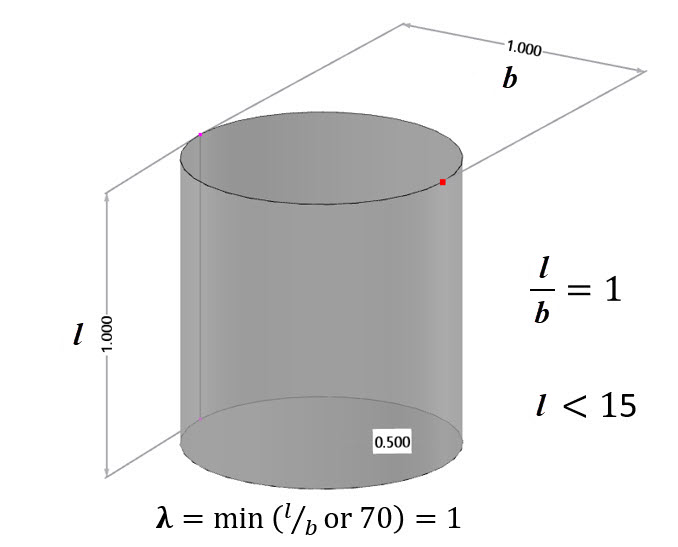
The dimensions of the cylinder, as shown in Figure 1, are designed to achieve a Reynolds number of Re= 2*106 based on Equation 7.15 of EN 1991-1-4. In this equation, b represents the cylinder diameter, ν is the kinematic viscosity of air (ν=15*10-6 m2/s), and v(ze) denotes the peak wind velocity at reference height ze:
The assumptions and recommended CFD settings, summarized in Table 1, demonstrate improved agreement with the pressure coefficient Cp and force coefficient values provided in the Eurocode example:
| Wind Velocity | V | 30 | m/s |
| Reynolds Number (Equation 7.15, EN 1991-1-4) | Re | 2*106 | - |
| Height | L | 1 | m |
| Diameter | D | 1 | m |
| Position of the Minimum Pressure/Flow Separation (Table 7.12, EN 1991-1-4) | αmin/αA | 80/120 | Degree |
| Value of the Minimum Pressure Coefficient (Table 7.12, EN 1991-1-4) | Cp0,min | -1.9 | - |
| Base Pressure Coefficient (Table 7.12, EN 1991-1-4) | Cp0,h | -0.7 | - |
| Solidity Ratio (Equation 7.28, EN 1991-1-4) | φ | 1 | - |
| Effective Slenderness (Table 7.16, EN 1991-1-4) | λ | 1 | - |
| End-Effect Factor (Figure 7.36 - Equation 7.17, EN 1991-1-4) | ψλ - ψλa | 0.6-(0.6-1) | - |
| Force Coefficient (Figure 7.28, EN 1991-1-4) | Cf,0 | 0.55 | - |
| Air Density | ρ | 1.25 | kg/m3 |
| Turbulence Model | Steady RANS k-ω SST | - | - |
| Kinematic Viscosity (Equation 7.15, EN 1991-1-4) | ν | 1.5*10-5 | m2/s |
| Scheme Order | Second | - | - |
| Residual Target Value | 10-5 | - | - |
| Residual Type | Pressure | - | - |
| Minimum Number of Iterations | 800 | - | - |
| Boundary Layer | NL | 10 | - |
| Type of Wall Function | Enhanced / Blended | - | - |
| Turbulence Intensity (Best Fit) | I | 7.5%-15% | - |
Results
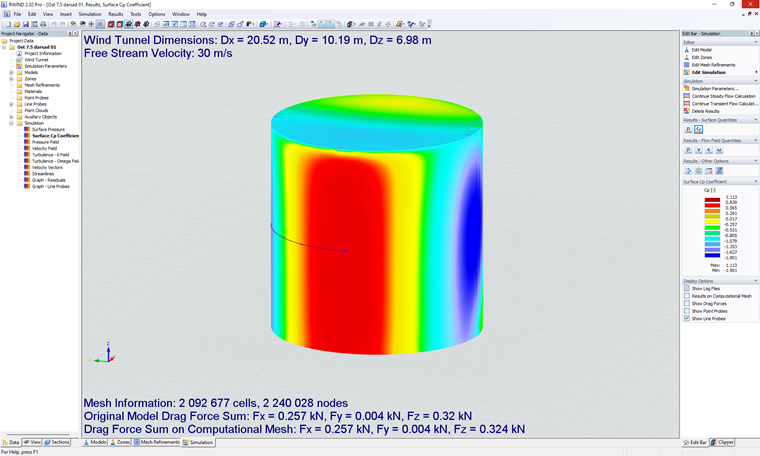
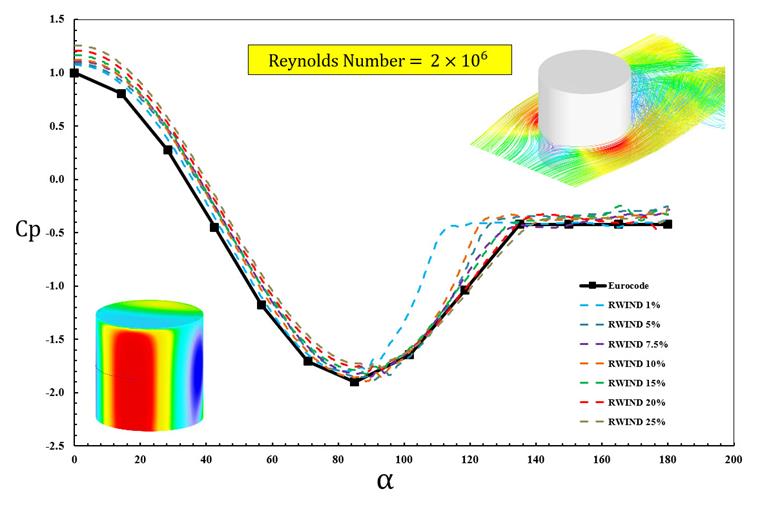
Finally, the Cp contour for turbulence intensity of 7.5% is shown in Figure 2, and the corresponding diagram for various turbulence intensities is presented in Figure 3. Among the tested cases, a turbulence intensity of I=7.5% demonstrates the best agreement in predicting the average wind pressure coefficient.
However, when considering another key parameter, the force coefficient Cf,0 (as listed in in Table 2 and referenced in Figure 7.28 of EN 1991-1-4), a turbulence intensity of 15% yields results that are more consistent with the Eurocode example.
| Turbulence Intensity (%) | Fd (N) | ρ (kg/m3) | u (m/s) | A (m2) | Cf,0 |
| 1.00 | 253 | 1.25 | 30 | 1 | 0.45 |
| 5.00 | 226 | 1.25 | 30 | 1 | 0.40 |
| 7.50 | 253 | 1.25 | 30 | 1 | 0.46 |
| 10.00 | 257 | 1.25 | 30 | 1 | 0.46 |
| 15.00 | 303 | 1.25 | 30 | 1 | 0.54 |
| 20.00 | 328 | 1.25 | 30 | 1 | 0.58 |
| 25.00 | 361 | 1.25 | 30 | 1 | 0.64 |
| Eurocode | - | - | - | - | 0.55 |
Additionally, the cylinder model with recommended CFD settings is available to download here: