Answer:
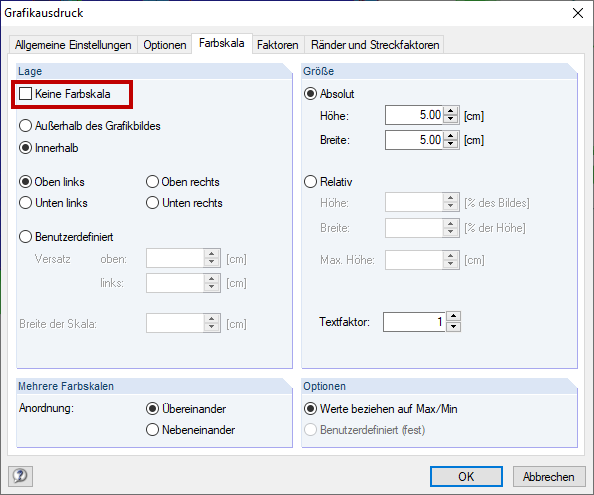
When printing a graphic in the printout report, you can select the position of the color scale in the "Color Scale" tab. Furthermore, you can adjust the size of the color scale in the same dialog box. When deactivating the "No Color Scale" check box (Image 01), this is displayed in the graphic in the printout report.
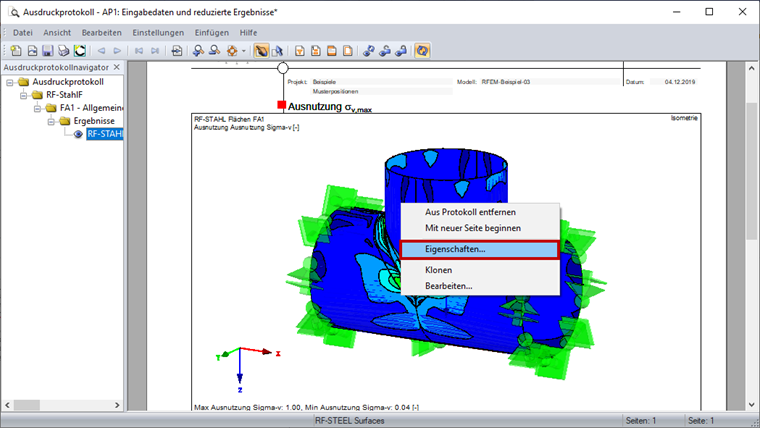
If a graphic has already been inserted into the printout report without a color scale, it is possible to display the color scale retroactively. To do this, right-click the picture. Then, select the properties in the shortcut menu (Image 02) to open the "Color Scale" tab. You can also edit the position and size of the color scale here.