Description
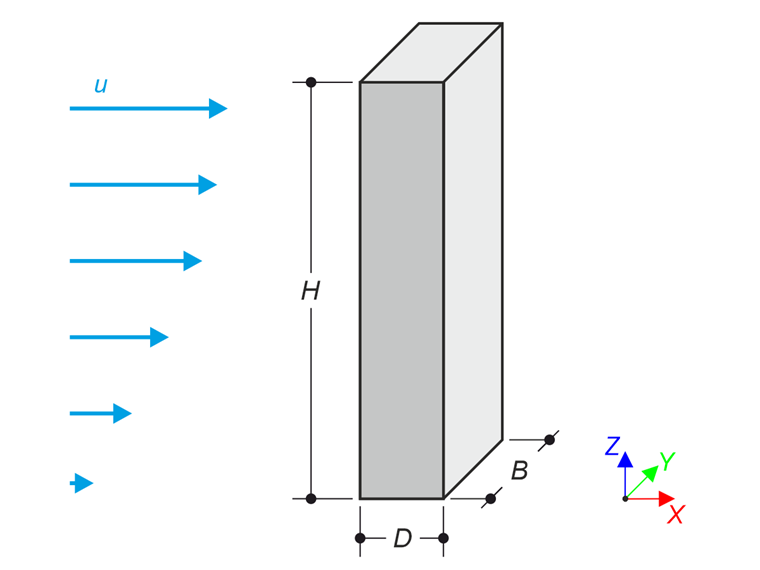
This verification case, based on the document of the German WTG: Fact Sheet of Committee 3 - Numerical Simulation of Wind Flows, Chapter 9.2 (see references), compares computational fluid dynamics calculations of wind pressure coefficients to experimental data from Tokyo Polytechnic University's (TPU) aerodynamic database (see references). The analysis focuses on a high-rise building model (ratio 2:1:5). TPU's boundary layer wind tunnel data – rigorously validated through peer-reviewed studies and publicly accessible via their wind engineering portal – provides benchmark metrics for assessing turbulence modeling accuracy and grid sensitivity effects.
While verification example VE0311 | Comparison of Wind Loads on High-Rise Building from Wind Tunnel Testing and CDF Simulation utilized the standard nutkWallFunction, this example evaluates the performance of the USpaldingWallFunction, which provides a continuous velocity profile across the entire boundary layer. Key comparison parameters include mean values of pressure coefficients at critical building zones (windward face, sidewalls, leeward separation regions) for both wall functions compared against experimental data.
| Fluid Properties | Kinematic Viscosity | ν | 1.500e-5 | m2/s |
| Density | ρ | 1.250 | kg/m3 | |
| Wind Tunnel | Length | Dx | 2720.000 | m |
| Width | Dy | 900.000 | m | |
| Height | Dz | 720.000 | m | |
| Building | Breadth | B | 80.000 | m |
| Depth | D | 40.000 | m | |
| Height | H | 200.000 | m | |
| Calculation Parameters | Reference Velocity | uref | 22.000 | m/s |
| Reference Height | zref | 10.000 | m | |
| von Kármán Constant | κ | 0.410 | ||
| Turbulence Viscosity Constant | Cμ | 0.090 | ||
| Aerodynamic Surface Rougness Length | z0 | 1.000 | m |
Analytical Solution
An analytical solution is not available. The example provides a comparison of RWIND CFD simulation results and experimental data (TPU Aerodynamic Database).
The wind speed profile is calculated from the Power Law according to the following formula:
where profile exponent α is defined as
The turbulence intensity is taken from the TPU Aerodynamic Database according to the following graph for α=0.25.

RWIND Simulation Settings
- Modeled in RWIND 3.07
- Transient flow simulation type
- Mesh density is 20% with refinements: 5,698,702 cells
- Spalart-Allmaras DDES model
- Wall function: USpaldingWallFunction (results compared with nutkWallFunction from VE 000311)
- Inlet boundary condition - velocity profile and turbulence intensity profile
- Tunnel bottom - no-slip boundary condition
- Tunnel walls and top - slip boundary condition
- Outlet boundary condition - zero pressure; zero velocity gradient
- A step-by-step calculation is performed, incorporating a user-defined entry of the applied wall function directly into the source file. The model used is identical to that in Verification Example 0311.
Results
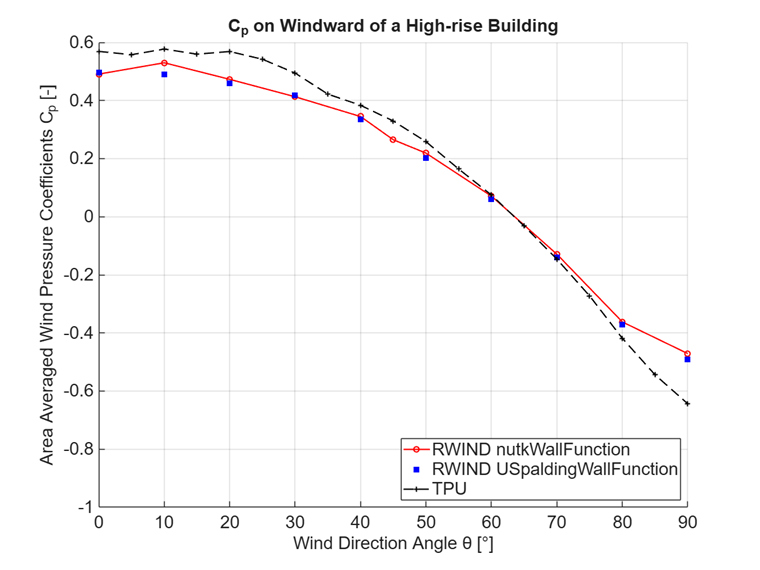
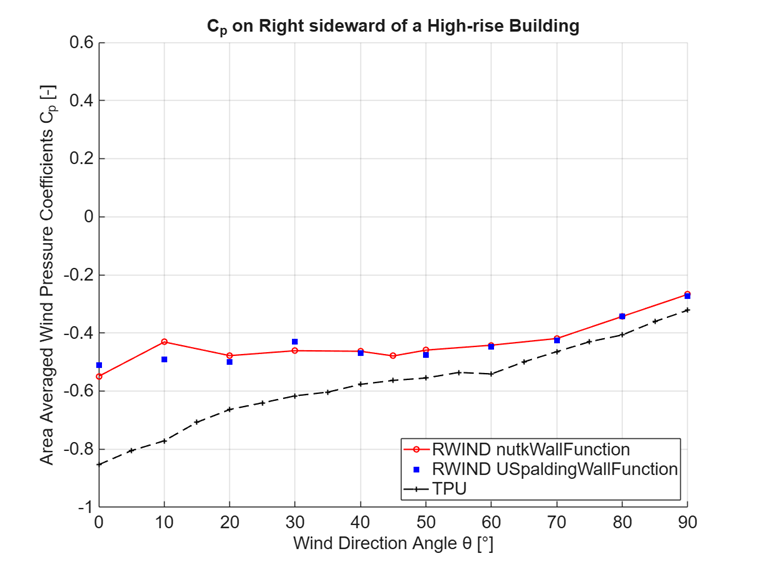
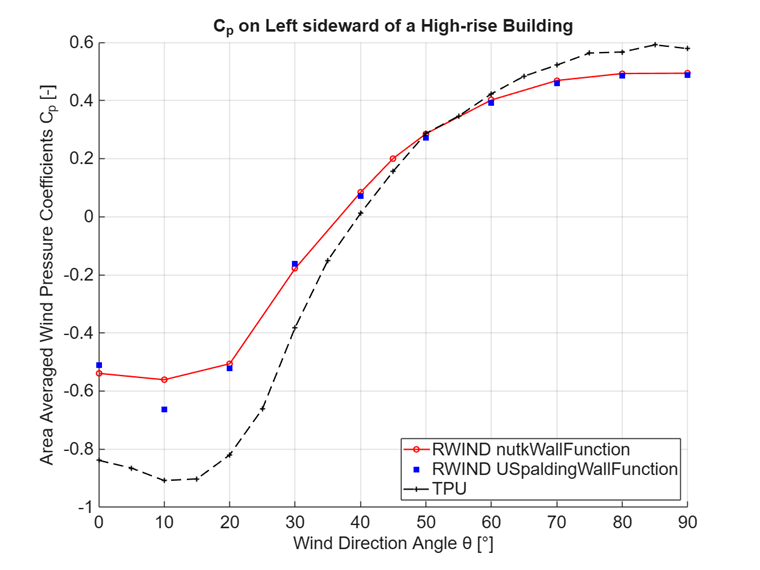
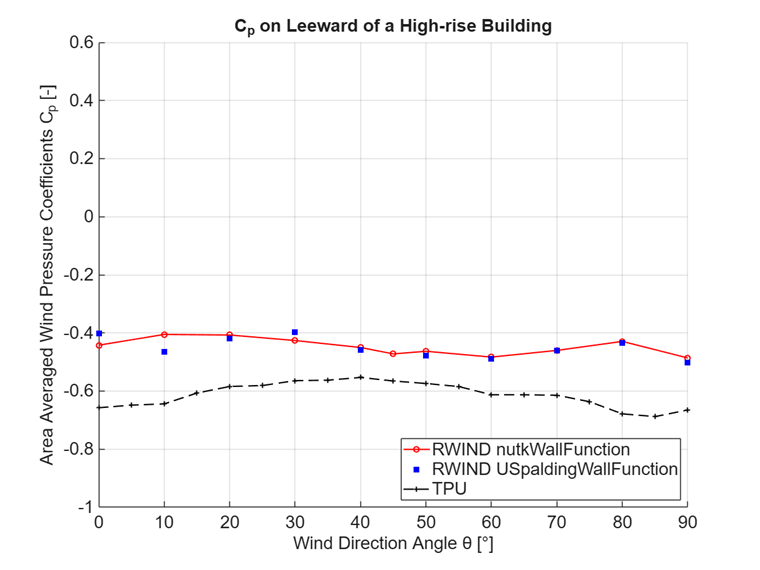
A graphical comparison of the average wind pressure coefficients obtained using the nutkWallFunction and USpaldingWallFunction in RWIND simulations is presented across the windward, leeward, right, and left surfaces of the building. These simulated values are evaluated against mean time-series data measured at test points from the TPU Aerodynamic Database. Overall, no significant deviation in the calculated data is observed between the two methods, illustrating the sensitivity—and stability—of the pressure distribution to the selected wall function treatment across the different building zones.
Remark: The experimental data shown in the graphs are plotted on the basis of data files obtained from the TPU website. However, the graphs shown on the TPU website match the data files only in the case of the windward surface.