4085x
004168
2021-04-30

Graphical Display of Nodal Displacements and Rotations

I would like to display global deformation with values, ideally colored according to size. Is it possible to set this?


Answer:

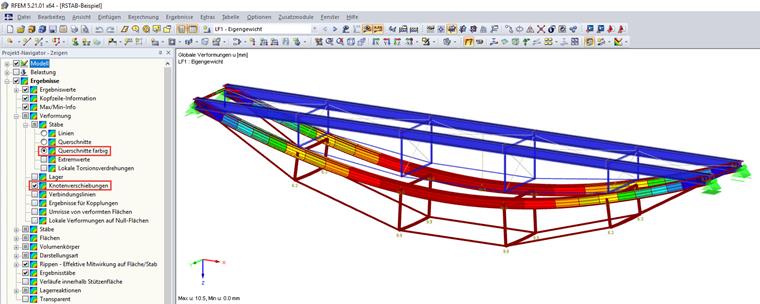
To control the graphical display of nodal displacements and nodal rotations, select the "Global Deformations" entry in the Results navigator.

Furthermore, it is possible to display the deformations not only as lines, but also as colored cross-sections in Project Navigator - Display.


Author

Sandy provides support in Customer Support for technical issues related to the software. She reliably familiarizes herself with new topics and helps develop clearly structured solutions.

References


;