


Introduction
In the context of numerical wind simulations and model validation, the reliability of computed results must be demonstrated through systematic comparison with reference data. Section 5.3.2 of the WTG-Merkblatt introduces a quantitative method for this purpose using the hit rate approach. This method provides a binary evaluation for each data point by checking whether the deviation between simulation result and reference value lies within a defined absolute or relative tolerance. The hit rate q is then calculated as the ratio of successfully validated points to the total number of considered points. This approach allows for an objective and reproducible assessment of simulation quality, especially for spatially distributed quantities such as surface pressures or force coefficients.
Definition of the Hit Rate
Based on WTG Section 5.3, in the field of reliability theory, the probability of failure is often determined using a confidence function that only recognizes the values 0 and 1. Analogously, in VDI 3783-9, a hit rate q is defined for prediction models, based on the number of "correctly" calculated result values Pi in comparison with the sufficiently significant reference values Oi as defined below:
|
N |
Total number of data points |
|
ni |
Indicator function (1 if prediction is “correct”, 0 otherwise) |
|
Pi |
Predicted value |
|
Oi |
Reference or measured value |
|
Wrel |
Allowed relative deviation |
|
W |
Allowed absolute deviation |
Table 1 (as Table 5.1 in WTG-Merkblatt M3) defines benchmark criteria for validating pressure coefficient results in CFD simulations. It sets maximum allowable deviations (10–20%) and requires a hit rate of over 90% for mean, RMS, and extreme values. These thresholds help ensure that the simulation data closely match the reference values and support consistent quality assessment.
Table 1: Exemplary Evaluation Criteria for Force and Pressure Coefficients
| Considered Value | Maximum Deviation (W) | Hit Rate (q) |
|---|---|---|
| Mean Value of the Pressure Coefficient | 10% | >90% |
| RMS Value of the Pressure Coefficient | 20% | >90% |
| Extreme Value of the Unsteady Pressure Coefficient | 20% | >90% |
Example: Evaluation of 12 Measurement Points on a Surface
Let's consider 12 measured reference values Oi and the corresponding simulation values Pi. We have used the relative deviation tolerance of W=10% for using average values.
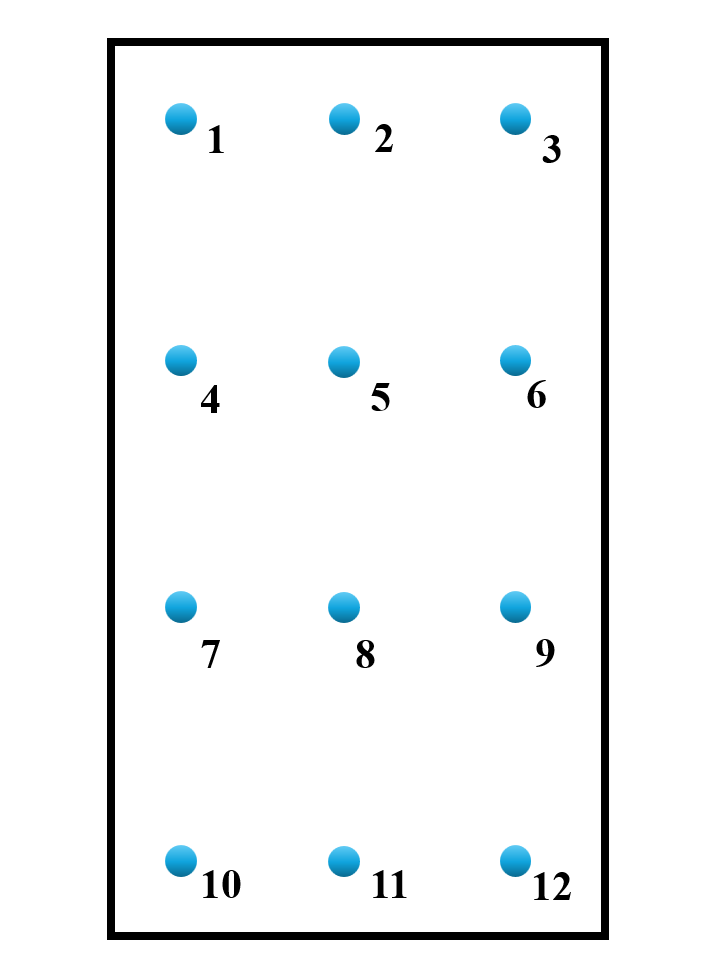
Table 1: Hit Rate Evaluation for Mean Value of 12 Measurement Points
| Point (i) | Reference Value (Oi) | Simulated Value (Pi) | Relative Deviation Wrel % | Hit rate (1 = Yes, 0 = No) |
|---|---|---|---|---|
| 1 | 0.72 | 0.75 | 4.17 | 1 |
| 2 | 0.68 | 0.70 | 2.94 | 1 |
| 3 | 0.81 | 0.85 | 4.94 | 1 |
| 4 | 0.77 | 0.73 | 5.19 | 1 |
| 5 | 0.66 | 0.69 | 4.55 | 1 |
| 6 | 0.74 | 0.71 | 4.05 | 1 |
| 7 | 0.85 | 0.80 | 5.88 | 1 |
| 8 | 0.70 | 0.66 | 5.71 | 1 |
| 9 | 0.81 | 0.88 | 8.64 | 1 |
| 10 | 0.76 | 0.69 | 9.21 | 1 |
| 11 | 0.82 | 0.75 | 8.54 | 1 |
| 12 | 0.69 | 0.80 | 15.94 | 0 |
Hit Rate: q=11/12≈91.7%
It meets the minimum requirement (>90%) for validating mean values. Only Point 12 exceeds the tolerance (10%).
Conclusion
The hit rate method offers a simple and transparent way to assess the quality of simulation results by quantifying how many values lie within acceptable deviations from reference data. It is particularly useful for pressure and force coefficient validation in wind simulations or aerodynamic studies. However, the selection of appropriate thresholds and the segmentation of data (e.g., by regions or dominant flow direction) play a crucial role in meaningful assessment.