


This study evaluates the design of steel joints for RFEM by investigating the ductility characteristics and failure modes of extended endplate beam-to-column connections. The structural behaviour and load-bearing capacity of these connections are analysed in accordance with the design provisions specified in Eurocode 3 (EC3), and the resulting predictions are subsequently validated through comparison with a finite element model developed using Steel Joints for RFEM, as well as with corresponding experimental data.
Analytical Model
This study adopts the design criteria specified in EN 1993-1-8 for evaluating bolt resistance (shear and tension) and plate resistance (bearing and punching shear), utilizing the limit state formulations provided in Table 3.4.
The design resistance of the equivalent T-stub is evaluated independently for the endplate and the column flange components. For each component, the governing design resistance, FT,Rd is defined as the minimum value derived from three potential failure mechanisms.
The individual resistance for each mode is calculated based on the plastic moment capacity of the flange (Mpl,1,Rd and Mpl,2,Rd) and the tension resistance of the bolt group (∑Ft,Rd). These modes account for complete flange yielding (Mode 1), bolt failure coupled with flange yielding (Mode 2), and pure bolt fracture (Mode 3).
Failure Modes:
Plastic Resistance Moments:
The initial stiffness of the connection is given by the formula:
Where
E is the Young's modulus,
z is the lever arm,
Ki is the stiffness coefficient of the ith component and
n is the number of basic joint components.
Geometric Details of Beam-to-Column Connection
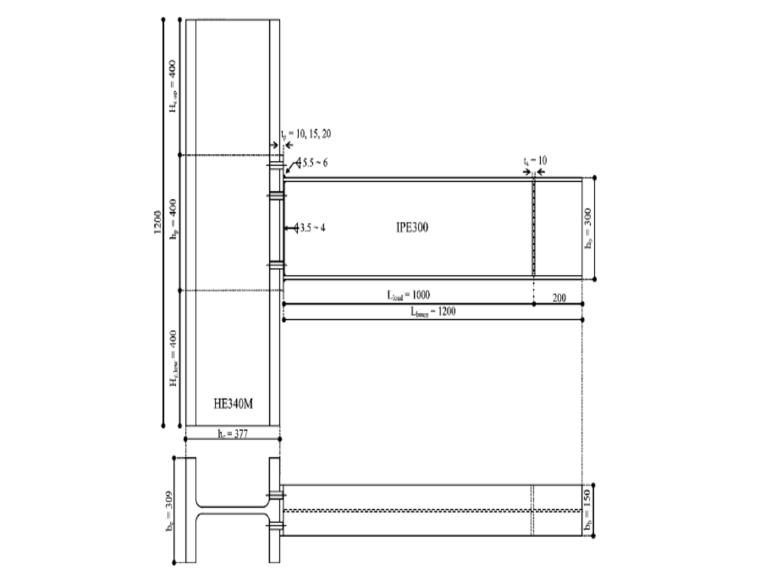
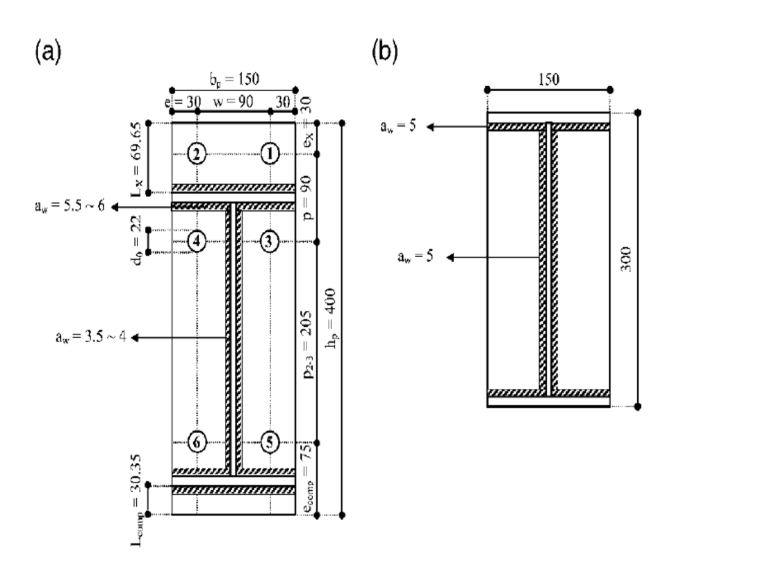
All beam and column members were fabricated from S355 steel following standard construction practice. Endplates were made from either S355 & S690 steel. Geometric details—including endplate dimensions and bolt group layouts—are shown in Image 2, while the test matrix and measured material properties are presented in Table 1.
Specimens FS1 through FS4 used an HEM 340 column section paired with an IPE 300 beam section. This configuration was chosen to examine weak-column strong-beam behaviour. Across all four specimens, the beam section remained constant at IPE 300, with endplate thicknesses of 10, 15, 20, and 10 mm for FS1, FS2, FS3, and FS4, respectively.
| Specimens | Column | Steel grade | Beam | Steel Grade | Endplate Thickness, mm | Steel Grade |
|---|---|---|---|---|---|---|
| FS1 | HEM340 | S355 | IPE300 | S235 | 10 | S355 |
| FS2 | HEM340 | S355 | IPE300 | S235 | 15 | S355 |
| FS3 | HEM340 | S355 | IPE300 | S235 | 20 | S355 |
| FS4 | HEM340 | S690 | IPE300 | S235 | 10 | S690 |
Discussion
Steel Joints for RFEM Solution
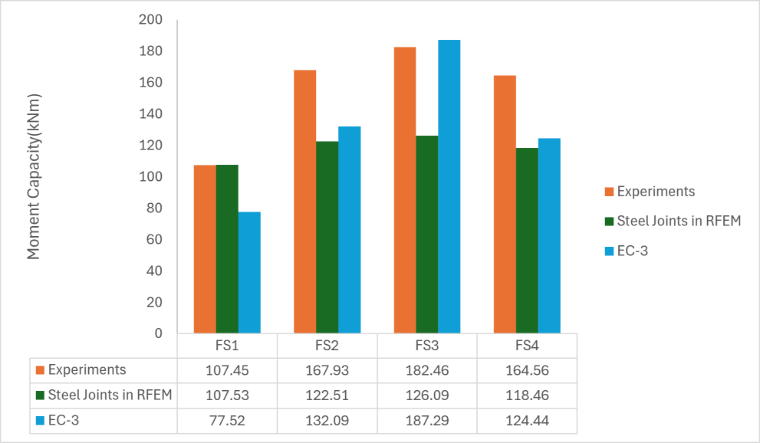
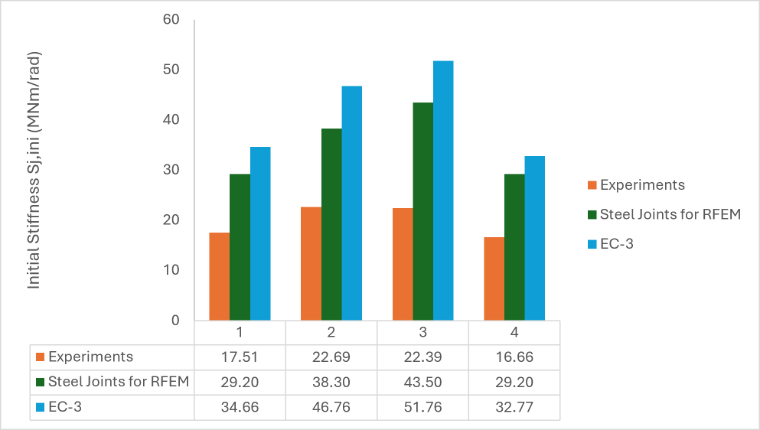
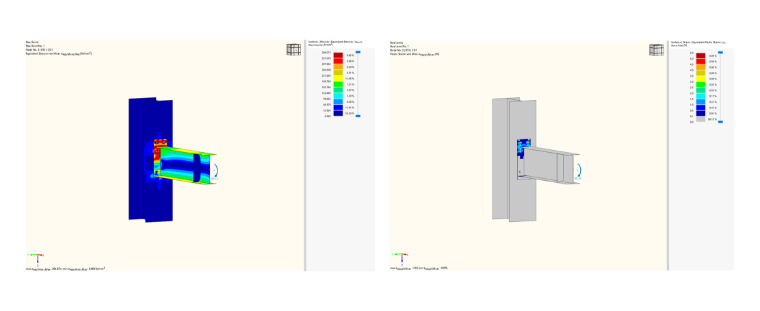
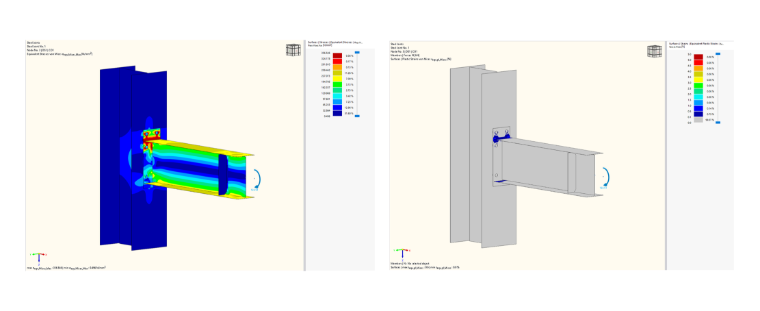
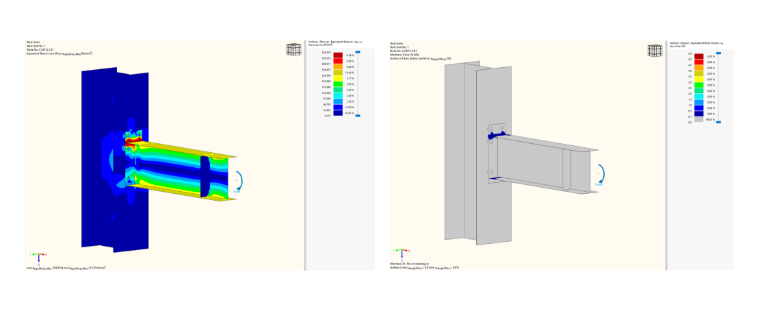
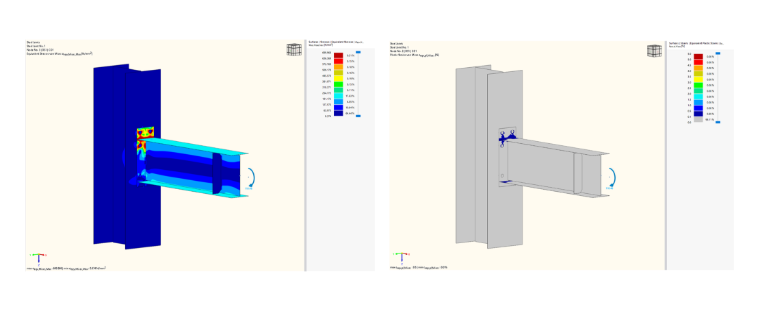
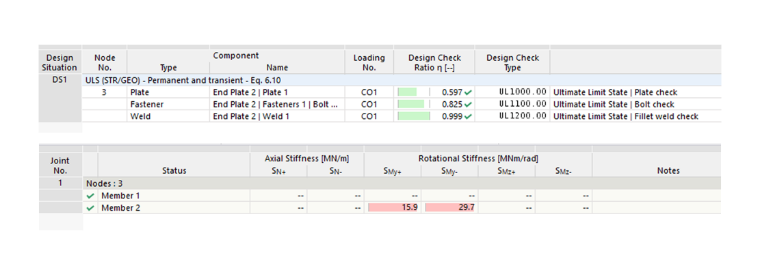
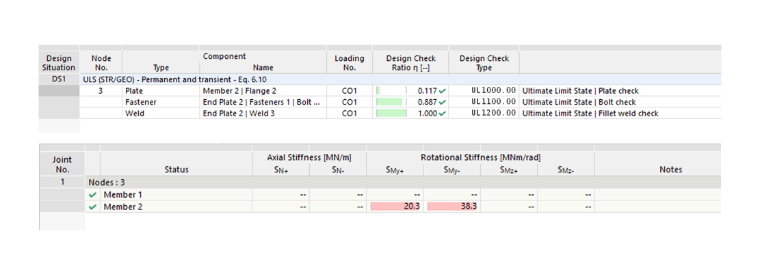
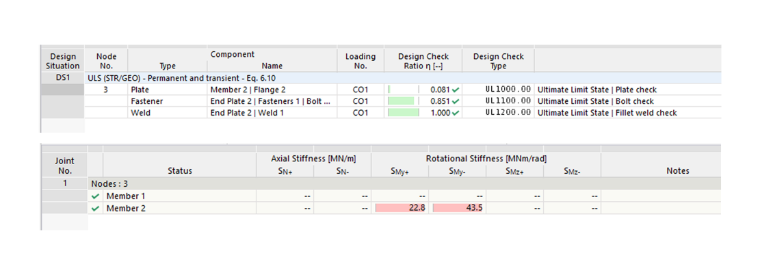
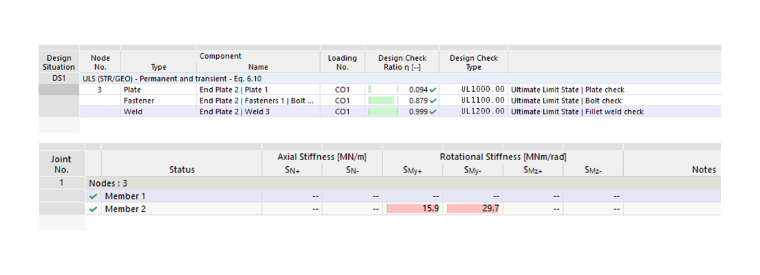
Using the Steel Joints add-on for RFEM 6, the connection design was fully integrated within the primary structural model. This study presents an experimental and numerical investigation into the structural performance of four extended end-plate beam-to-column connections, with particular emphasis on ductility assessment. The investigation was complemented by targeted T-stub component characterization and high-fidelity finite element (FE) analysis. The developed FE models were validated against experimental measurements and verified against the Eurocode 3 (EC3) design framework, then employed to extract detailed insights into localized deformation behavior. Images 3 and 4, along with Tables 2 and 3, present comparisons of moment resistance and rotational stiffness among the experimental results, the Steel Joints for RFEM 6 predictions, and the EC3 analytical solutions.
| Specimens | Experiments | Steel Joints in RFEM | EC3 |
|---|---|---|---|
| FS1 | 107.45 | 107.53 | 77.52 |
| FS2 | 167.93 | 122.51 | 132.09 |
| FS3 | 182.46 | 126.09 | 187.29 |
| FS4 | 164.56 | 118.46 | 124.44 |
| Specimens | Experiments | Steel Joints for RFEM | EC3 |
|---|---|---|---|
| FS1 | 17.51 | 29.20 | 34.66 |
| FS2 | 22.69 | 38.30 | 46.76 |
| FS3 | 22.39 | 43.50 | 51.76 |
| FS4 | 16.66 | 29.20 | 32.77 |
Conclusions
The comparison between experimental, Steel Joints for RFEM component-based, and EC-3-1-8 predictions shows that the RFEM model provides good overall agreement with test results for both moment resistance and initial stiffness, confirming its reliability for representing the actual joint behavior. EC-3-1-8 predictions for moment resistance vary across specimens (ratios of 0.72–1.49 relative to RFEM), reflecting the sensitivity of the analytical component method to specific geometric parameters such as plate thickness and bolt layout. The results demonstrate that Steel Joints for RFEM provides a notably more accurate prediction of initial joint stiffness than the EC-3 analytical method. This confirms RFEM's finite-element-based approach better captures the actual stiffness behaviour of the tested connections, making it a more reliable tool for practical design and analysis compared to the conservative, and often overly simplified, EC3 component method.