
In addition to JavaScript, the Python high-level functions are also available in the console. Using the Python option, the console also provides you with the Python HLF functions known from the WebService function catalog for further use in the object properties dialog box for in-app scripting.
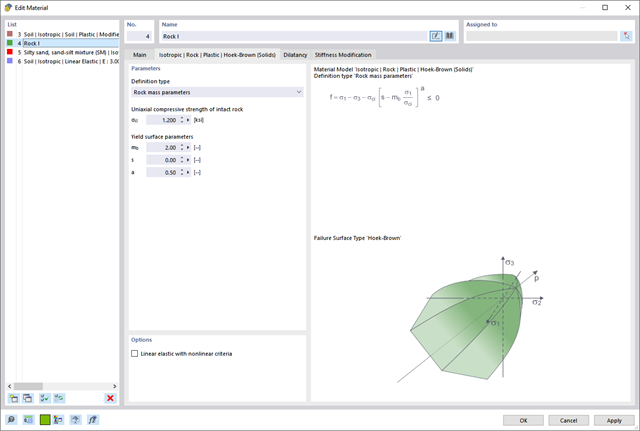
In the Geotechnical Analysis add-on, the Hoek-Brown material model is available. The model shows linear-elastic ideal-plastic material behavior. Its nonlinear strength criterion is the most common failure criterion for stone and rocks.
You can enter the material parameters using
- Rock parameters directly, or alternatively via
- GSI classification.
Detailed information about this material model and the definition of the input in RFEM can be found in the respective chapter Hoek-Brown Model of the online manual for the Geotechnical Analysis add-on.
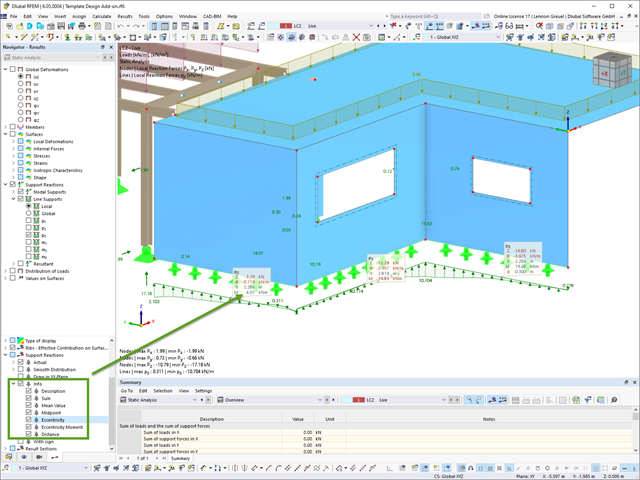
For line support results, you can optionally display certain additional information in info bubbles, such as description, sum, mean value, and so on.
If necessary, you can activate the info bubbles in the Navigator – Results.
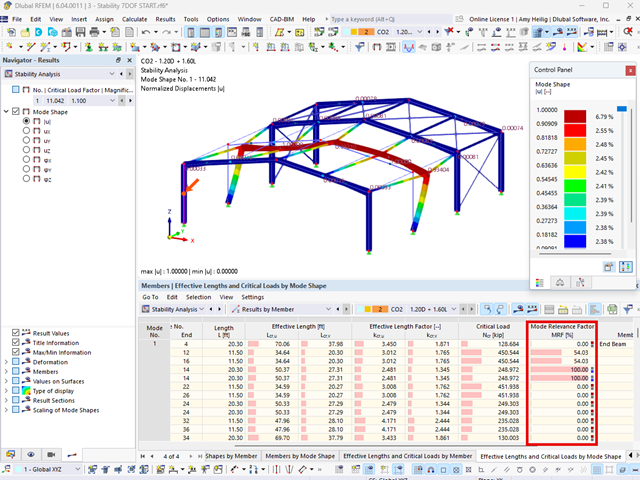
The modal relevance factor (MRF) can help you to assess to which extent specific elements participate in a specific mode shape. The calculation is based on the relative elastic deformation energy of each individual member.
The MRF can be used to distinguish between local and global mode shapes. If multiple individual members show significant MRF (for example, > 20%), the instability of the entire structure or a substructure is very likely. On the other hand, if the sum of all MRFs for an eigenmode is around 100%, a local stability phenomenon (for example, buckling of a single bar) can be expected.
Furthermore, the MRF can be used to determine critical loads and equivalent buckling lengths of certain members (for example, for stability design). Mode shapes for which a specific member has small MRF values (for example, < 20%) can be neglected in this context.
The MRF is displayed by mode shape in the result table under Stability Analysis → Results by Members → Effective Lengths and Critical Loads.
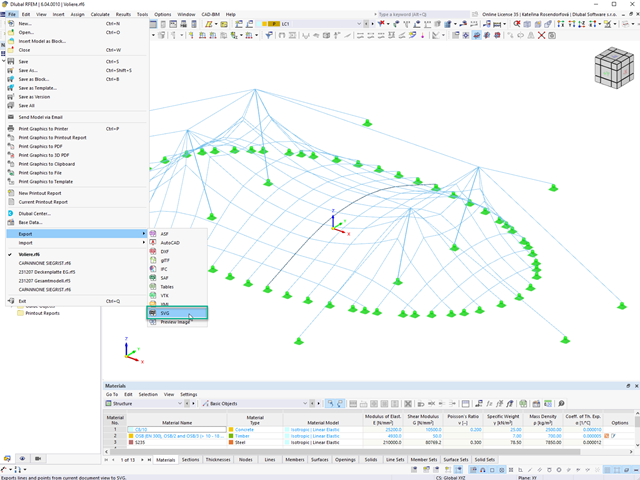
In RFEM 6 and RSTAB 9, you can export line graphics to the SVG format (vector graphics).
SVG stands for Scalable Vector Graphics and is an XML-based file format for displaying two-dimensional vector graphics. These vector graphics can be scaled without loss. It is possible to edit the SVG files using text editors, embed them on websites, and open them in the usual browsers.
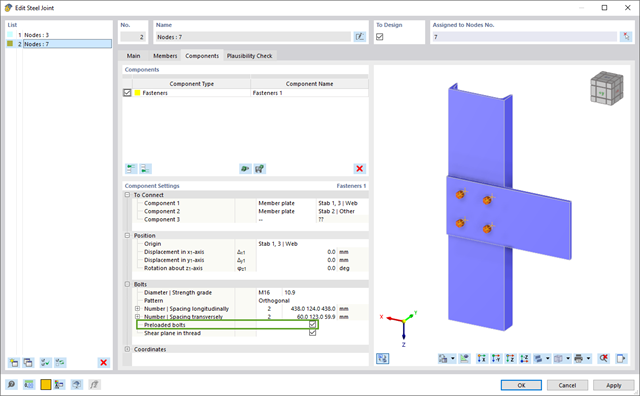
In the "Steel Joints" add-on, you can consider preloaded bolts in all components during the calculation. You can easily activate the preloading using the check box in the bolt parameters, and it has an impact on the stress-strain analysis as well as the stiffness analysis.
Preloaded bolts are special bolts used in steel structures to generate a high clamping force between the connected structural components. This clamping force causes friction between the structural components, which allows for the transfer of forces.
Functionality
Preloaded bolts are tightened with a certain torque, causing them to stretch and generate a tensile force. This tensile force is transferred to the connected components and leads to a high clamping force. The clamping force prevents the connection from loosening and ensures safe force transmission.
Advantages
- High load-bearing capacity: Preloaded bolts can transfer large forces.
- Low deformation: They minimize the deformation of the connection.
- Fatigue strength: They are resistant to fatigue.
- Easy assembly: They are relatively easy to assemble and disassemble.
Analysis and Design
The calculation of preloaded bolts is performed in RFEM using the FE analysis model generated by the "Steel Joints" add-on. It takes into account the clamping force, friction between structural components, shear strength of bolts, and load-bearing capacity of the structural components. The design is carried out according to DIN EN 1993‑1‑8 (Eurocode 3) or the US standard ANSI/AISC 360‑16. You can save the created analysis model, including the results, and use it as an independent RFEM model.
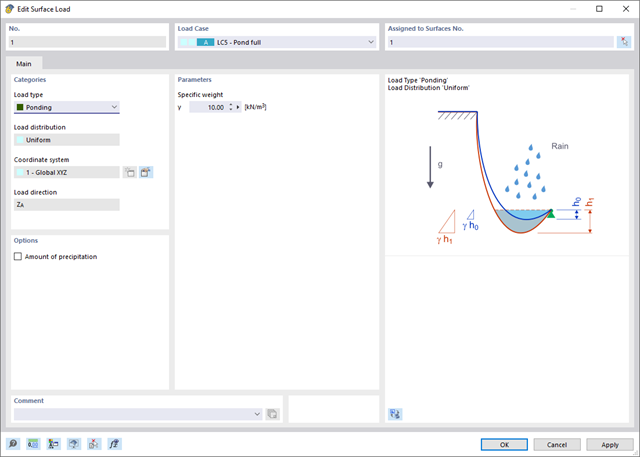
The Ponding load type allows you to simulate rain actions on multi-curved surfaces, taking into account the displacements according to the large deformation analysis.
This numerical rainfall process examines the assigned surface geometry and determines which rainfall portions drain away and which rainfall portions accumulate in puddles (water pockets) on the surface. The puddle size then results in a corresponding vertical load for the structural analysis.
For example, you can use this feature in the analysis of approximately horizontal membrane roof geometries subjected to rain loading.
Go to Explanatory Video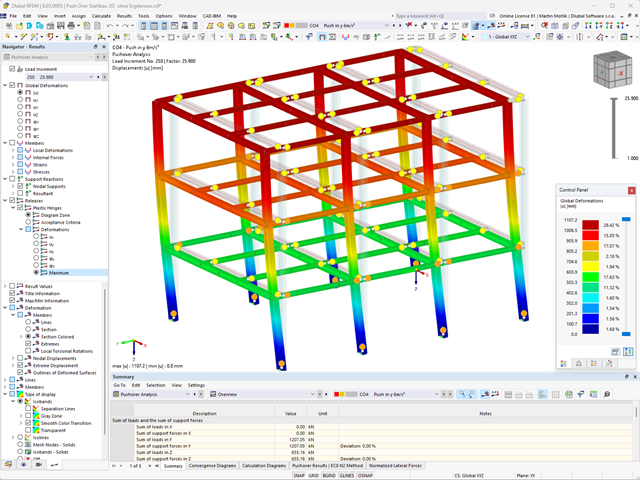
- Consideration of nonlinear component behavior using plastic standard hinges for steel (FEMA 356, EN 1998‑3) and nonlinear material behavior (masonry, steel - bilinear, user-defined working curves)
- Direct import of masses from load cases or combinations for the application of constant vertical loads
- User-defined specifications for the consideration of horizontal loads (standardized to a mode shape or uniformly distributed over the height of the masses)
- Determination of a pushover curve with selectable limit criterion of the calculation (a collapse or limit deformation)
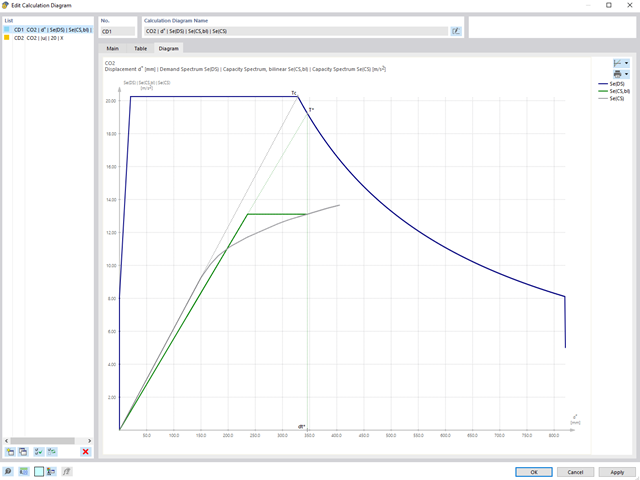
- Transformation of the pushover curve into the capacity spectrum (ADRS format, single degree of freedom system)
- Bilinearization of the capacity spectrum according to EN 1998‑1:2010 + A1:2013
- Transformation of the applied response spectrum into the required spectrum (ADRS format)
- Determination of target displacement according to EC 8 (the N2 method according to Fajfar 2000)
- Graphical comparison of the capacity and required spectrum
- Graphical evaluation of the acceptance criteria of predefined plastic hinges
- Result display of the values used in the iterative calculation of the target displacement
- Access to all results of the structural analysis in the individual load levels
During the calculation, the selected horizontal load is increased in load steps. A static nonlinear analysis is carried out for each load step until reaching the specified limit condition.
The results of the pushover analysis are extensive. On one hand, the structure is analyzed for its deformation behavior. This can be represented by a force-deformation line of the system (a capacity curve). On the other hand, the response spectrum effect can be displayed in the ADRS display (Acceleration-Displacement Response Spectrum). The target displacement is automatically determined in the program based on these two results. The process can be evaluated graphically and in tables.
The individual acceptance criteria can then be graphically evaluated and assessed (for the next load step of the target displacement, but also for all other load steps). The results of the static analysis are also available for the individual load steps.
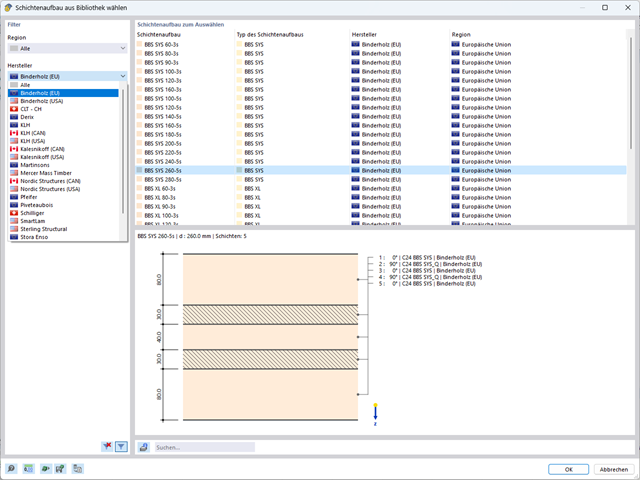
A library for cross-laminated timber panels is implemented in RFEM, from which you can import the manufacturer's layer structures (for example, Binderholz, KLH, Piveteaubois, Södra, Züblin Timber, Schilliger, Stora Enso). In addition to the layer thicknesses and materials, there is also the information about stiffness reductions and the narrow side bonding.
Go to Explanatory Video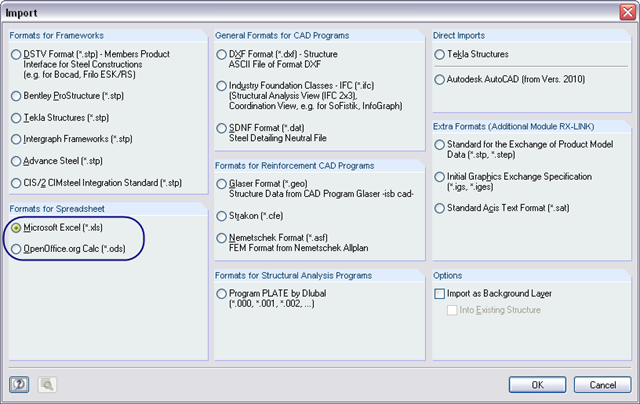
You can import table values from a prepared Excel table into RFEM 6 / RSTAB 9 with just a few clicks – either individually or all at once. For the import, you need to install a plug-in in Microsoft Excel according to this FAQ.
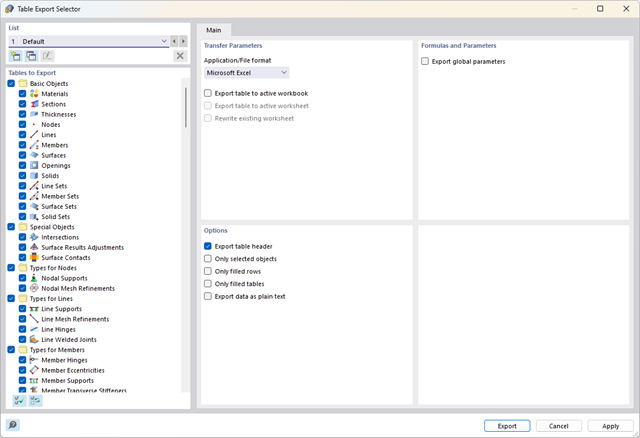
Did you know? You can export all RFEM/RSTAB tables with the results individually or all at once directly into an Excel table or as a CSV file. There are several options available to you:
- With table headers
- Selected objects only
- Filled rows only
- Only filled tables
- Export data as plain text
This way, the program allows you to control and clearly manage the exported data. You can export the stored formulas directly in the table or as a separate table, as in the case of the used parameters.
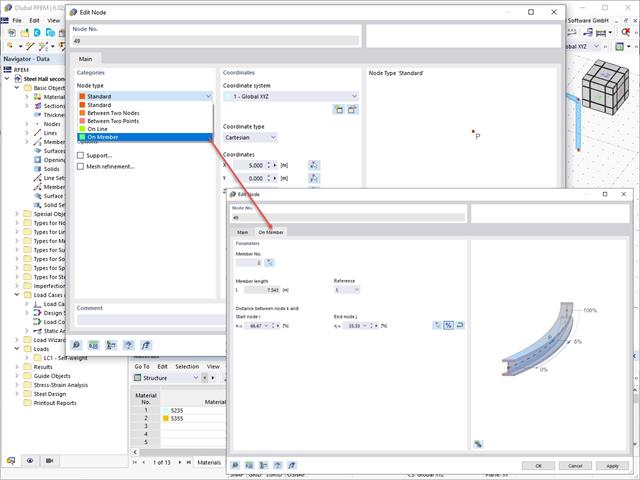
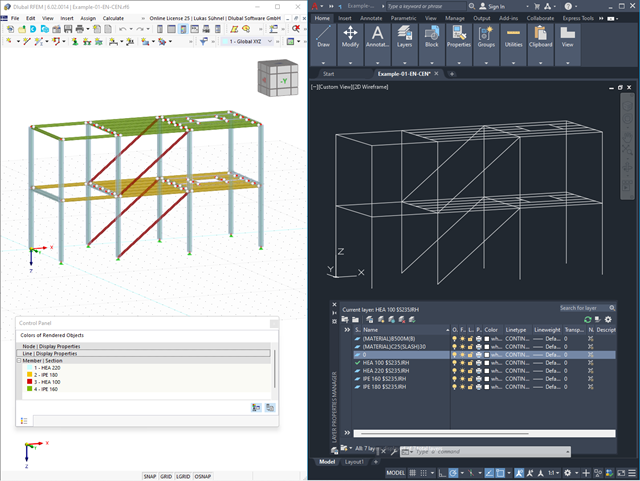
Use the Edit Nodes function to adjust the node type with the automatic specification of all necessary secondary properties. You also have the option to transfer a node to a line or to a member, or to place it between two nodes and two points.
.png?mw=640&hash=55038d2a1591f62179796666cb9b2fede0274e19)
A graphical and tabular output of the results for deformations, stresses, and strains helps you when determining the soil solids. To achieve this, use the special filter criteria for targeted selection of results.
The program doesn't leave you alone with the results. If you want to graphically evaluate the results in the soil solids, you can use the guide objects. For example, you can define clipping planes. This allows you to view the corresponding results in any plane of the soil solid.
And not just that. The utilization of result sections and clipping boxes facilitates the precise graphical analysis of the soil solid.
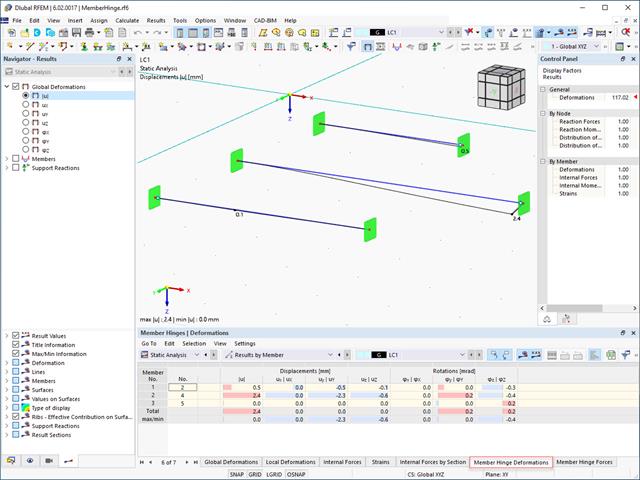
The results for members can be displayed graphically, using the Member Hinges navigator category. The numerical results of member hinges can be found in the Results by Member table category. The Member Hinge Deformations and Member Hinge Forces tables are available for the analysis and documentation of the deformation and force results in the area of member hinges.
The table lists the deformations and forces of each member for the locations specified in the Results Table Manager. There, you can also control which extreme values are displayed.
- Calculation of deflections and comparison with the normative or manually adjusted limit values
- Consideration of a precamber for the deflection analysis
- Different limit values are possible, depending on the design situation type
- Manual Adjustment of Reference Lengths and Segmentation by Direction
- Calculation of deflections related to the initial structure or to the deformed structure
- Further detailed design checks depending on the selected design standard (for example, vibration design according to EN 1999‑1‑1, 7.2.3)
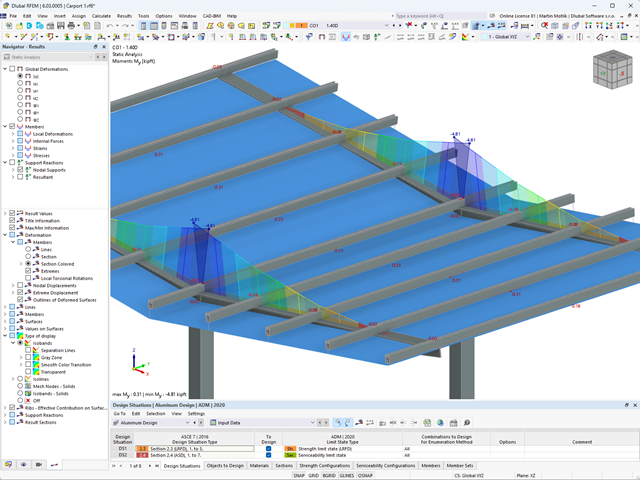
- Graphical result display integrated in RFEM/RSTAB; for example, the design ratio of a limit value, or the deformation or the sag
- Complete integration of the results into the RFEM/RSTAB printout report
The program does a lot of work for you. For example, the load or result combinations required for the serviceability limit state are generated and calculated in RFEM/RSTAB. You can select these design situations for the deflection analysis in the Aluminum Design add-on. Depending on the specified precamber and reference system, the program determines the deformation values at each location of a member. They are then compared to the limit values.
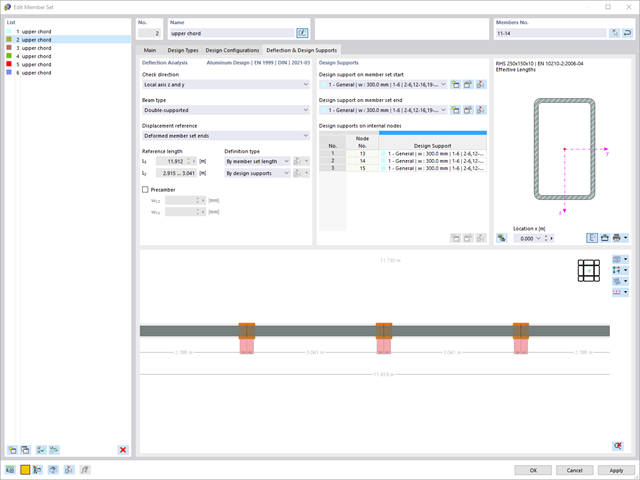
You can specify the deformation limit value individually for each structural component in Serviceability Configuration. In this case, you define the maximum deformation depending on the reference length as the allowable limit value. By defining design supports, you can segment the components. In this way, you can determine the corresponding reference length automatically for each design direction.
And that's not all. Based on the position of the assigned design supports, the program allows you to automatically determine the distinction between beams and cantilevers. The limit value is thus determined accordingly.
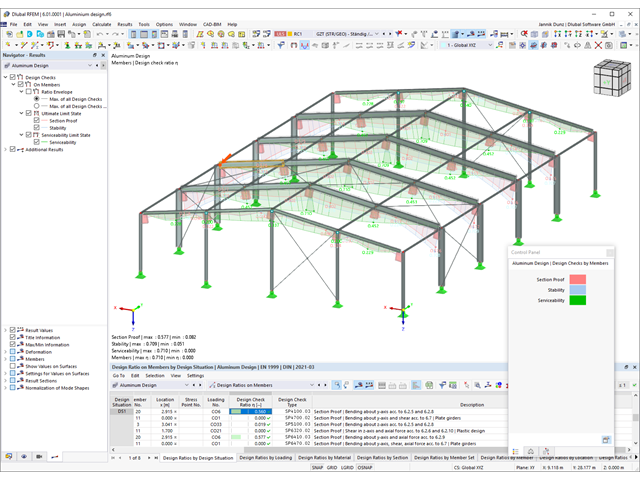
You can find the serviceability limit state design checks in the result tables of the Aluminum Design add-on. They are already fully integrated there. You have the option to display the design results with all the details at each location of the designed members. You can also use graphics with the result diagrams of the design ratios.
You can integrate all result tables and graphics into the global printout report of RFEM/RSTAB as a part of the aluminum design results. RFEM/RSTAB also allows you to display and document the deformations of the entire structure independently of the add-on.
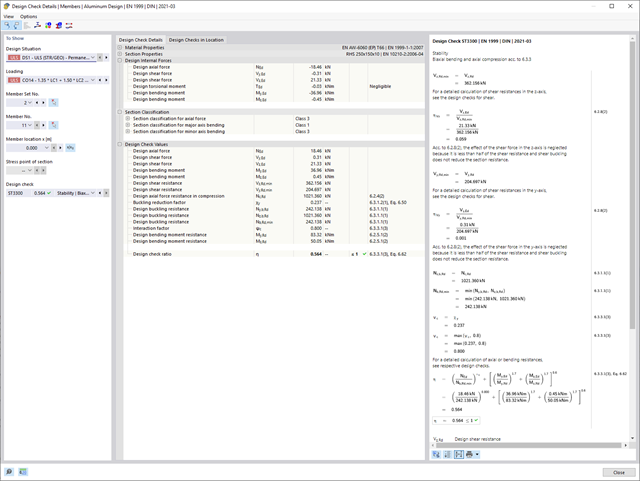
Do you prefer it clear? So do we! That's why all performed design checks for the design standard are displayed for you in a clear way. You determine a design criterion for each design check. You get design details, which include the initial values, intermediate results, and final results, arranged in a structured way for each design check. You can find the calculation process with the applied formulas, standard sources, and results in great detail in an information window in the design details.
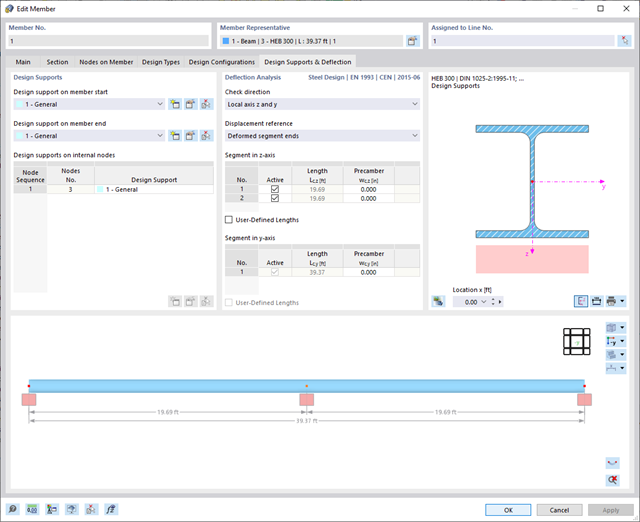
When calculating the deflection limit, you have to consider certain reference lengths. You can define these reference lengths and the segments to be checked independently of each other, depending on the direction. For this, define design supports at the intermediate nodes of a member and assign them to the respective direction for the deformation analysis. Thus, the segments are created where you can define a precamber for each direction and segment.
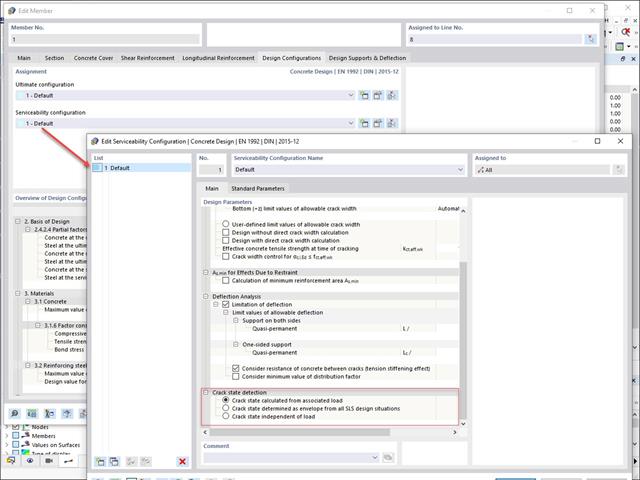
Various design parameters of the cross-sections can be adjusted in the serviceability limit state configuration. The applied cross-section condition for the deformation and crack width analysis can be controlled there.
For this, the following settings can be activated:
- Crack state calculated from associated load
- Crack state determined as an envelope from all SLS design situations
- Cracked state of cross-section - independent of load
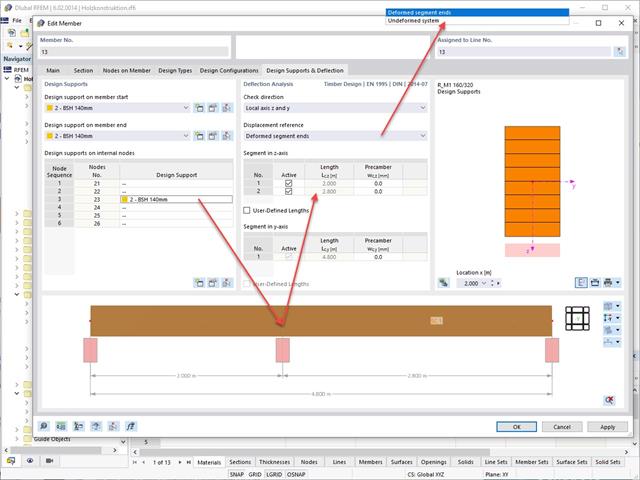
In the "Deflection and Design Support" tab under "Edit Member", the members can be clearly segmented using optimized input windows. Depending on the supports, the deformation limits for cantilever beams or single-span beams are used automatically.
By defining the design support in the corresponding direction at the member start, member end, and intermediate nodes, the program automatically recognizes the segments and segment lengths to which the allowable deformation is related. It also automatically detects whether it is a beam or a cantilever due to the defined design supports. The manual assignment, as in the previous versions (RFEM 5), is no longer necessary.
The "User-Defined Lengths" option allows you to modify the reference lengths in the table. The corresponding segment length is always used by default. If the reference length deviates from the segment length (for example, in the case of curved members), it can be adjusted.
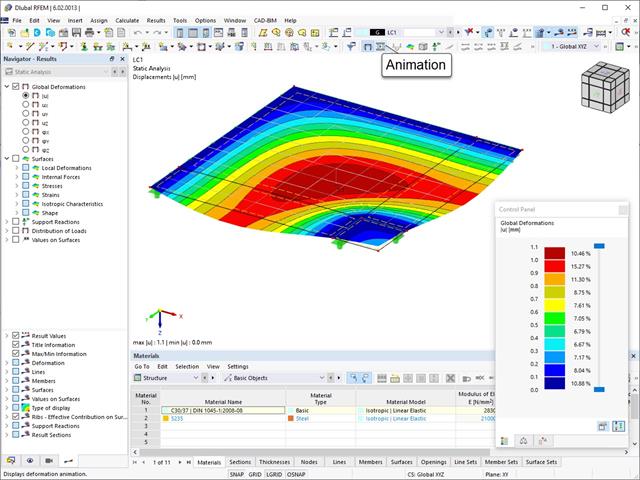
The deformation process of the global deformation components can be represented as a movement sequence.
Use the interfaces for more efficient work. You can import your structures in the DXF format as lines from Autodesk AutoCAD into RFEM 6 / RSTAB 9.
Furthermore, you can export different objects (for example, cross-sections) from RFEM 6 / RSTAB 9 to separate layers in Autodesk AutoCAD.
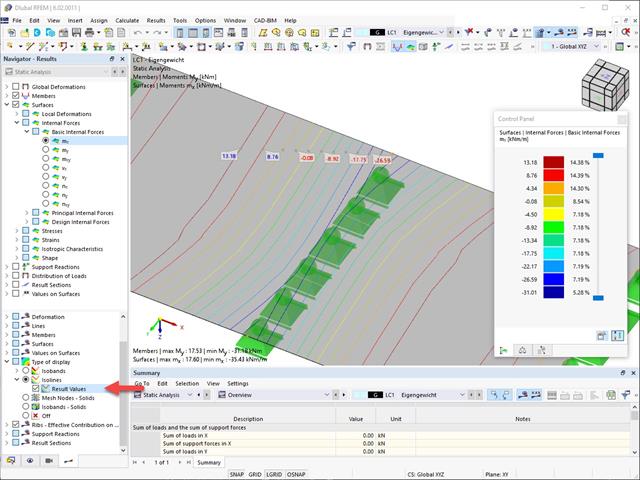
Result values for deformations, internal forces, stresses, and so on, can be displayed on the isolines.
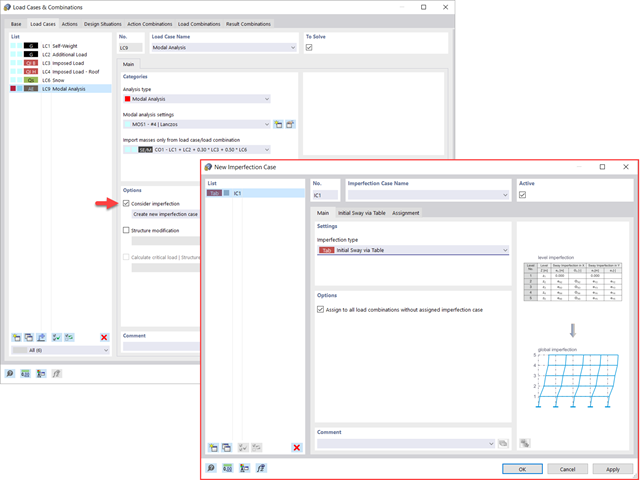
You can already see it in the image: Imperfections can also be taken into account when defining a modal analysis load case. The imperfection types that you can use in the modal analysis are notional loads from load case, initial sway via table, static deformation, buckling mode, dynamic mode shape, and group of imperfection cases.
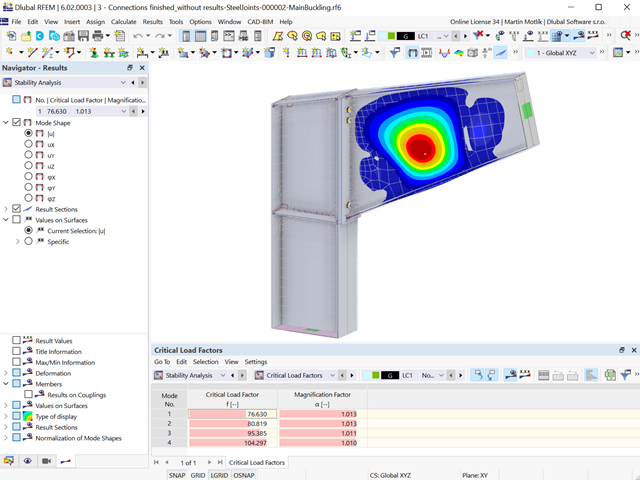
- The steel connections model and the results can be saved as a separate model file
- The resulting stresses and the results of the stability analysis (joint buckling) can be displayed in a separate model
- In the saved model, you can run a deformation animation on the connection
- Connection components are converted to surfaces and members when they are saved
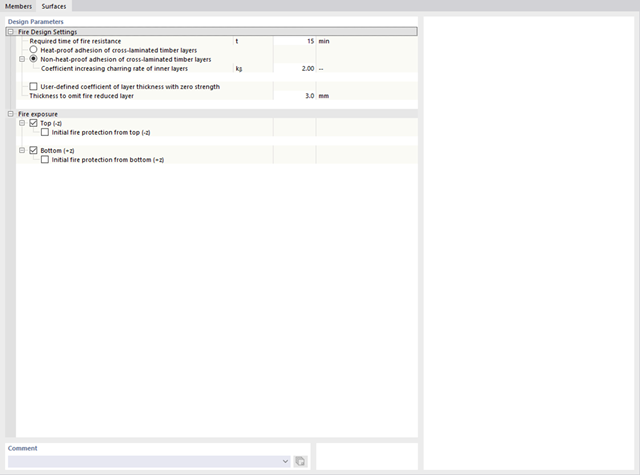
RFEM/RSTAB also provides a range of functions for the case of a fire. The program allows for the automatic generation of load and result combinations for the accidental design situation of fire design. The members to be designed with the corresponding internal forces are imported directly from RFEM/RSTAB. Also, all information about the material and cross-section is stored. You don't need to do anything else.
You only define the parameters relevant for the fire resistance design by assigning a fire resistance configuration to the members and surfaces to be designed. Moreover, you can also make further detailed settings, such as the definition of the fire exposure on one side up to all sides.
Dlubal Software just makes everything a little easier. The performed design checks of the design standard are displayed in a clear way. A design criterion is determined for each design check. Furthermore, the program deliver the design details displayed in a structured way, including the initial values, the intermediate results, and the final results. An information window in the design details shows you the calculation process with the applied formulas, standard sources, and results in great detail.
Did you know? You can individually define the reference lengths to be considered in the calculation of the deflection limit value and the segments to be checked, depending on the direction. For this, define design supports at the intermediate nodes of a member and assign them to the respective direction for the deformation analysis. In the resulting segments, you can also define a precamber for each direction and segment.