Wind hazards often result in significant damage to the built environment cascading into impacts on the socio-economic systems within a community. The increasing frequency and intensity of hurricane hazards highlight the importance of developing high-resolution wind hazard models to better predict the consequences.
Although previous studies have investigated hurricane-induced wind hazards in terms of hazard modeling and the subsequent vulnerability of buildings and infrastructure, these studies have not yet investigated applications of computational fluid dynamics (CFD) at the community-level.
Therefore, in this study, a novel approach was developed to generate CFD models at the community-level by integrating building information modeling (BIM) and geographical information systems (GIS) to automate the generation of a high-resolution 3-D community model to be used as an input for a digital wind tunnel.
This was done by harnessing the current advances in BIM and GIS applications and maximizing their capabilities by developing an algorithm that automates the 3-D geometry generation of communities with a detailed discretization of each building within the community. The 3-D community model was developed using the GIS shapefile of the buildings’ footprint and a parametric BIM model that uses a number of building parameters such as footprint dimensions, roof shape, foundation type, and the number of stories.
Then, an algorithm was developed to automate the creation of the BIM model for each building within the community based on the prescribed building’s characteristics. The developed community model was used as an input for a numerical wind tunnel that uses CFD to account for the detailed wind pressure at each building after including the impacts of aerodynamics interference at the community-level.
This novel BIM-GIS integration approach provides, for the first time, the next generation of high-resolution community-level CFD wind hazard modeling which aims to shift the current practice of wind hazard simulation at the community-level.
1. Úvod
Nebezpečí hurikánů je jedním z nejčastějších nebezpečí v USA, které ohrožuje fyzickou infrastrukturu pobřežních komunit (Abdelhady et al., 2020 [1]; Nofal, 2021 [2]). Ohrožení hurikány může způsobit značné poškození obvodového pláště budovy a vážné poškození konstrukčního systému budovy (Amini a Memari, 2020 [3]).
Vzhledem k tomu, že nebezpečí hurikánů zesílilo (Kossin, 2017 [4]), bylo vyvinuto několik modelů proudění větru pro předpovídání pole hurikánů a intenzity větrného nebezpečí (Vickery et al., 2009 [5]). Holland vyvinul jeden z nejlépe zavedených modelů větru pro hurikány, který může předpovídat profil tlaku větru (Holland, 1980 [6]).
Darling vytvořil model relativní intenzity hurikánu s použitím pravděpodobnostního rozdělení (Darling, 1991 [7]). Vickery a kol. ([8]) vyvinul empirický přístup k předpovědi dráhy hurikánu na základě konceptu relativní intenzity vyvinutého Darlingem. V poslední době byly vyvinuty pokročilejší modely dráhy hurikánů, jako například stochastický model dráhy (Emanuel et al., 2006 [9]) a další, které využívají statistické modely spolu s historickými údaji o hurikánech (Hall a Jewishson, 2007 [10]).
Bylo vyvinuto několik modelů útlumu ohrožení hurikány poté, co byl zahrnut vliv pevninského terénu na rychlost útlumu intenzity větrného ohrožení nad pevninou (Vickery a Twisdale, 1995 [11]; Liu a Pang, 2011 [12]). Nakonec byly vyvinuty pokročilé modely větru pro hurikány pomocí metody simulace velkých vírů (LES) pro model Weather Research and Forecasting (WRF) (Zhu, 2008 [13]).
I když tyto přístupy významně přispěly k modelování nebezpečí větru, v současné literatuře stále chybí přístup s vysokým rozlišením, který by dokázal zachytit dopad aerodynamických interferencí na úrovni obce.
Věrnost modelu ohrožení větrem použitého při analýze může významně ovlivnit výsledný vypočítaný tlak větru na budovy a následné posouzení poškození. Vyhodnocení poškození větrem se obvykle provádí pomocí řady modelů zranitelnosti větrem, které byly vyvinuty pro posouzení poškození/ztrát na budovách a infrastruktuře, popsaných s souhrnné studii ((Pita et al., 2015 [14]).
Tato studie ukazuje, že v průběhu posledních 2 desetiletí byly vyvinuty různé typy funkcí zranitelnosti větrem, včetně deterministických (např. Emanuel et al., 2006 [8]; Pinelli et al., 2011 [15]; Pita et al., 2012 [16]) a pravděpodobnostní modely (např. Mishra et al., 2017 [17]; Khajwal a Noshadravan 2020 [18]).
Modely zranitelnosti větrem založené na křehkosti byly v posledních 2 desetiletích středem zájmu literatury, protože umožňují šíření nejistoty procesem vyhodnocení poškození (Li a Ellingwood, 2006 [19]; Massarra a kol., 2020 [20]; Nofal, 2020 [21]; Wang a kol., 2021 [22]). Bylo vyvinuto několik funkcí křehkosti budov pro různé typologie budov, včetně obytných (Masoomi a kol., 2018 [23]), komerčních (Koliou a kol., 2017 [24]) a veřejných (Masoomi a van de Lindt, 2016 [25]).
Vyvinuta byla také řada funkcí pro zranitelnost hurikány s více riziky, které zahrnovaly kombinované dopady vzdutí a vln spolu s nebezpečím větru (Masoomi et al., 2019 [26]). Vyvinuty byly také funkce zranitelnosti pro kombinovaný vliv rychlosti větru a trosek unášených větrem (Abdelhady et al., 2021 [27]). Dále byla vyvinuta řada přístupů k hodnocení rizika hurikánů na úrovni obce s více riziky, aby bylo možné provést vyhodnocení rizikovosti hurikánů ve velkých prostorových měřítkách (Nofal et al., [28]; [29]).
Přestože všechny tyto modely rizika hurikánů na úrovni obce jsou nové a významně přispěly k literatuře o větru, jsou založeny na jednoduchých modelech větru, které nezohledňují vliv aerodynamických interferencí na úrovni obce.
Přestože je pro posouzení rizika vzniku hurikánů klíčové detailní modelování pole větru v hurikánu, důležitá je také správná diskretizace zastavěného prostředí, aby bylo možné zohlednit tlak větru na každou exponovanou budovu (Du et al., 2018 [30]). Terén a topologie budov mohou měnit intenzitu ohrožení větrem v důsledku interakce mezi prouděním větru a budovami (Ren a kol., 2018 [31]; Wenz a kol., 2021 [32]).
Kromě toho může účinek stínění větru způsobený rozptylem budov v prostoru exponované oblasti významně změnit tlak větru na exponované budovy (Wiren, 1983 [33]; Liu a kol., 2018 [34]). Proto bylo provedeno vícero studií, které zkoumaly interakci mezi nebezpečím větru a budovami z hlediska kolísání tlaku větru přes obvodový plášť budovy (Schulman a DesAutels, 2013 [35]; Abdelfatah a kol., 2020 [36], 2022 [37]; Amini a Memari, 2021 [38]).
Přestože došlo k pokroku v přístupech k modelování pomocí CFD a ke zlepšení účinnosti výpočtových modelů, v současné literatuře stále chybí přístup, který by mohl automatizovat proces modelování komunity pomocí podrobné diskretizace na úrovni budovy s hlavním cílem lepšího modelování aerodynamické interference na úrovni obce.
CFD modely větru na úrovni obce jsou totiž výpočetně náročné a vyžadují dostatek času na modelování a zpracování. Také numerické modelování geometrie obce je náročné, pokud zahrnuje detailní diskretizaci všech budov v rámci obce.
Pro posouzení škod větrem a rizik na úrovni obce se současná literatura stále opírá o 2D rastrové mapy ohrožení, kde se rychlost větru získává lokálně ve středu každé budovy. Tento přístup nezohledňuje vliv aerodynamických interferencí, a proto ovlivňuje přesnost vypočítaného tlaku větru na každou budovu.
Technologie BIM umožňuje modelování detailních informací o stavebních prvcích včetně interiérů, nosných i nenosných prvků. Tato technologie usnadnila správu různých typů stavebních dat pro použití v různých fázích životního cyklu budovy, včetně analýzy a posouzení, výstavby, provozu, údržby a oprav.
Všechny výhody používání BIM technologie však ještě nebyly plně využity a stále existuje řada různých aplikací. Z BIM můžeme profitovat využitím BIM ve výzkumu a aplikacích pro přírodní katastrofy (Amirebrahimi et al., 2016 [39]). Současné pokroky v aplikacích GIS navíc umožnily modelování zastavěného prostředí a zpracování rozsáhlých struktur dat (De Risi a kol., 2013 [40]; Nofal a van de Lindt, 2020 [41], 2021 [42]).
Neboť jsou již tyto pokroky v GIS významné, výzkum přírodních rizik je může využít k vývoji modelů obcí s vysokým rozlišením. V poslední době proběhlo několik studií, které zkoumaly proveditelnost integrace BIM a GIS modelů z hlediska automatického georeferencování BIM modelů v prostředí GIS na úrovni budov (El Meouche a kol., 2013 [43]; Diakite a Zlatanova, 2020 [44]). Neboť jsou tyto studie nové, i když významně přispěly k literatuře o integraci BIM-GIS, zastavily se před vytvořením BIM modelu pro celou obec.
Tato studie se snaží zaplnit tuto mezeru ve výzkumu pomocí pokroků v technologiích GIS a BIM a vyvinout přístup, který dokáže automatizovat generování BIM modelů pro obec s podrobnou diskretizací budov v rámci obce. Modelování aerodynamických interferencí na úrovni obce vyžaduje diskretizaci zastavěného prostředí tak, aby bylo možné modelovat interakci mezi ohrožením větrem hurikánu a budovami v rámci obce.
To vyžaduje 3D model obce s řádnou charakteristikou budov a infrastruktury pro správný výpočet tlaků větru na každou budovu. Každou budovu v rámci tohoto modelu lze poté diskretizovat tak, že se zohlední údaje o místních budovách, jako je typ základu, počet podlaží a tvar střechy, spolu s dalšími globálními údaji o budově s ohledem na obec, včetně polohy, nadmořské výšky, orientace a tvaru půdorysu budovy. Integrace mezi BIM a GIS umožní 3D modelování obcí s detailní diskretizací budov v rámci obce.
V tomto příspěvku byl vyvinut nový přístup integrace BIM-GIS pro automatizaci procesu BIM modelování zastavěného prostředí. Vyvinutý přístup těží z aplikací BIM a GIS ve výzkumu přírodních rizik, konkrétně při tvorbě 3D geometrie obce, která má být použita jako vstup pro CFD analýzu. This was done using a parametric BIM model to generate the different building typologies within the community.
A novel algorithm was developed in Revit Dynamo that uses the GIS shapefile of the footprint of the buildings within the community as an input and then performs a number of parametric operations on the building attributes within this shapefile. These attributes include building footprint shape, number of stories, roof shape, and foundation type. The new algorithm used these attributes to automate the generation of the geometry of each building within the community and deliver a final BIM file for the entire community with detailed modeling of the different buildings within the community.
This new BIM-GIS integration approach allowed automating the development of a physical model of the entire community to be used as an input geometry for a digital wind tunnel to conduct CFD simulations. Then, the maximum wind speed generated by a hurricane can be modeled as a boundary condition for the digital wind tunnel which allowed a detailed characterization of the aerodynamics interference across each building within the community.
This approach allows the analyst to account for detailed wind pressure at each building within the community which can be used as an input for wind vulnerability analysis. The developed CFD hurricane-induced wind hazard model is considered a proof-of -concept for the next generation of high-fidelity wind risk analysis at a community scale with further applications likely for community resilience planning. Note that the wind fidelity is considered high with respect to community scale, but not for convention single structure scale CFD.
2. Methodology
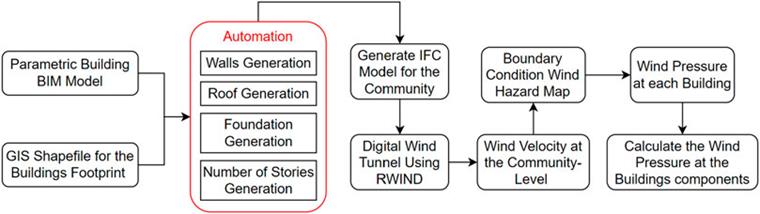
A novel BIM-GIS integration approach was developed to automate the generation of a 3-D geometry of communities after discretizing the different building typologies within the community. Image 1 shows a schematic flowchart for the methodology with the main models and the essential input data for these models. This approach allows the generation of a high-resolution 3-D geometry of the community that can be used as an input for a digital wind tunnel to account for the wind aerodynamic effects at the community-level.
The final wind hazard map can be used to generate a high-fidelity wind risk model that accounts for the damage to each building within the community. The wind velocity at the community-level can be generated as one of the direct outputs from developed approach to account for the sheltering effects induced by the different building patterns. Furthermore, component-level outputs can be generated to identify wind pressure for specific components such as walls and roofs.
BIM-GIS Integration Model
A novel approach was developed to integrate BIM with GIS in this natural hazards-focused research which are two main technologies used in the Architectural, Engineering, and Construction (AEC) industry. The two providers with the market share majority of this technology are AutoDesk (for BIM) and ESRI (for GIS), who have been working closely over the last few years to integrate these technologies, and recently published the first tool that integrates BIM and GIS in one computational environment which is ArcGIS GeoBIM.
However, the applicability of this tool is limited to the AEC industry with much more focus on the detailed building-level perspective as a part of the built environment. The BIM-GIS integration approach developed herein focuses on the community-level perspective such that the essential building details are included in the integration process. This integration process starts by collecting detailed building information about the buildings within the community and developing a spatial representation of the building data in terms of a GIS shapefile.
This shapefile should include the essential attributes of the buildings within the community including footprint shape, number of stories, roof type, and foundation type. Next, an algorithm was developed to read the building attributes to be used as input for a parametric BIM model. This parametric BIM model starts to generate the geometry for each building based on the input data provided. The geometry can be detailed such that each building component can obtain different component-level data assignments, e.g. different wall material, different wall types, different foundation types, etc.
The developed approach uses a GIS model of the community in terms of a shapefile of the footprint of each building within the community. This shapefile has detailed attributes of each building within the community including footprint shape, number of stories, foundation type, and roof shape. These attributes are either available online, can be purchased from data providers, or can be collected using Google Street Map View.
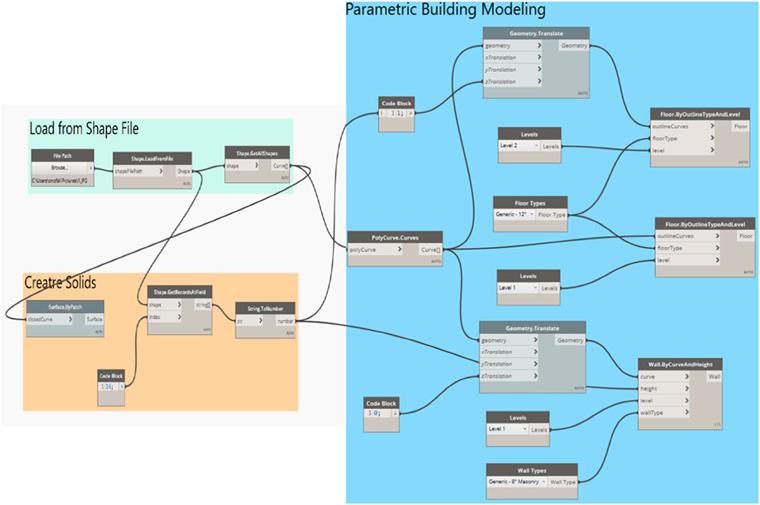
Also, a parametric BIM model was developed in Revit Dynamo to use the attributes of the building from the community shapefile and automate the generation of these buildings. Image 2 shows the logic behind the developed algorithm in terms of a Revit Dynamo developed to link between the GIS shapefile of the community and the developed parametric BIM model to generate the geometry of each building within the community.
The buildings’ geometry generation automation process includes developing walls, roof, foundation, and the number of stories for each building based on the provided building attributes. The 3-D BIM model of the community was transformed into the International Foundation Class (IFC) extension which was then used as input for a digital wind tunnel to account for the wind pressure at each building after including the impact of aerodynamics interference.
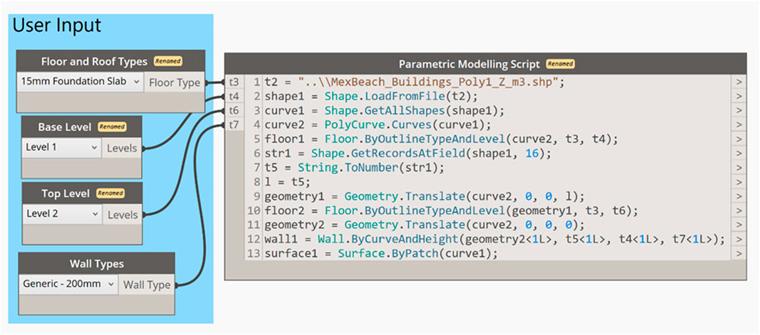
The BIM-GIS integration algorithm is developed using Python and utilizes some existing libraries in Revit Dynamo such as GIS, clockwork, and bimorphnodes. The parametric BIM model generation code is provided as shown in Image 3 for a clear presentation of the developed integration process. The algorithm reads the GIS shapefile of the community of interest with the building attributes that is needed for the parameterized BIM modeling.
First, the GIS library in Revit Dynamo is used to load the attributes of interest from the available shapefile (e.g., number of stories, foundation type, roof shape, walls properties, etc.). If some of this data is not available in the GIS file, user input data can be used to augment the analysis and the algorithm. This data will be used to create the solid shape of the buildings by transforming the 2D footprint to 3D solid using the geometry library which is embedded in Revit Dynamo.
Also, coordinate transformation for the buildings’ footprint were also handled as a part of the developed algorithm to make sure that the generated buildings are properly georeferenced. The developed algorithm is currently limited for buildings only but can be used in the future automate the generation of some infrastructure such as water, power and transportation networks.
This can be done using the same process with detailed data about these networks in terms of a shapefile. This shapefile should have the networks topology, connectivity, dependency, etc. Then, a similar parametric model can be developed using this information to initiate geometry for this infrastructure.
Once the geometry of each building within the community was developed in terms of a BIM model that allows full characterization of buildings’ details, a full 3-D BIM model of the community can be generated. This 3-D community model has the essential geometrical information about the community that allows further wind- or water-structure interaction analysis.
The output level of details from the automation process of the generated 3-D BIM model of the community depends on the available information about the buildings that have been used as input for the model. If there is not any information available about the foundation type or the roof shape, the final generated community will be developed based on the assumed foundation type (e.g., slab on grade) and roof shape (e.g., flat roof), which may be somewhat typical for a community.
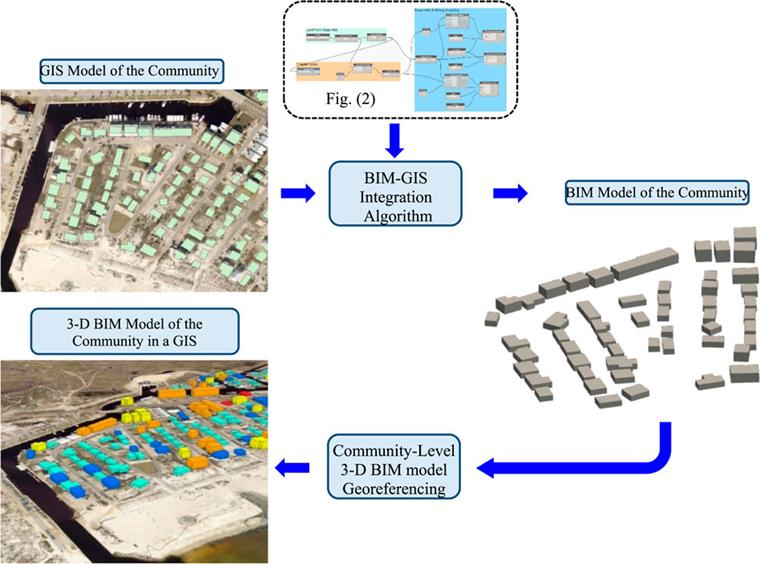
For example, while collecting building data, there are a number of buildings that are not accessible either in the field or in Google Street Map View. Then, reasonable assumptions for this data can be made about these buildings attributes based on the surrounding building types. The final 3-D BIM model of the community can be georeferenced to be integrated into a 3-D GIS environment. Image 4 shows a schematic workflow for the transformation process from the 2-D GIS community model to the 3-D integrated BIM-GIS community model.
In the future, this algorithm can be extended to include the topography of the study area in terms of the terrain elevation and how it impacts the aerodynamic interference. This can be done by incorporating the digital elevation map (DEM) of the study area to identify the ground elevation at each building and thereby adjusting the elevation of each building. Also, this algorithm will be used to model other infrastructure such as the power network which will require details geo-spatial information about the power transmission and distribution line (e.g., poles/towers height, geometry, location, etc.).
Wind Hazard Modeling
In this research, the main focus is on hurricane-induced wind hazards, but the methodology applies to any straight-line wind hazard. The hurricane wind analysis is usually conducted with a pixel size in terms of kilometers to enable solving such extensive numerical wind field models (e.g., the Holland Model).
Vijayan et al. ([45]) investigated the impact of different wind parameters on the final generated wind field for Hurricane Michael in 2018 based on the Holland Model. The size of the unstructured mesh used to develop this model ranges from 25 km over water and 1 km overland. While these wind models are novel and provided a significant contribution to the hurricane-induced wind hazard modeling, these models are not sufficient to predict wind speed and wind pressure at each building within the community.
This is because the solver used in these numerical wind models only switches the exposure factor from overwater to overland to account for the wind velocity in urban communities which does not account for the detailed aerodynamics interference resulting from wind-structure interaction. Also, these models do not account for the sheltering effects specifically for buildings on the coastline.
The resolution used in the current models produced from, e.g., ADCIRC, in terms of the pixel size used to generate the unstructured mesh does not allow the capture of the variation in wind speed across the community.
Therefore, community-level CFD-based solutions will provide more accurate wind results even if these solutions are using some simplification such as using large mesh size. Since the surface roughness will be much better represented than using exposure factor that represent a constant roughness without including the sheltering effect.
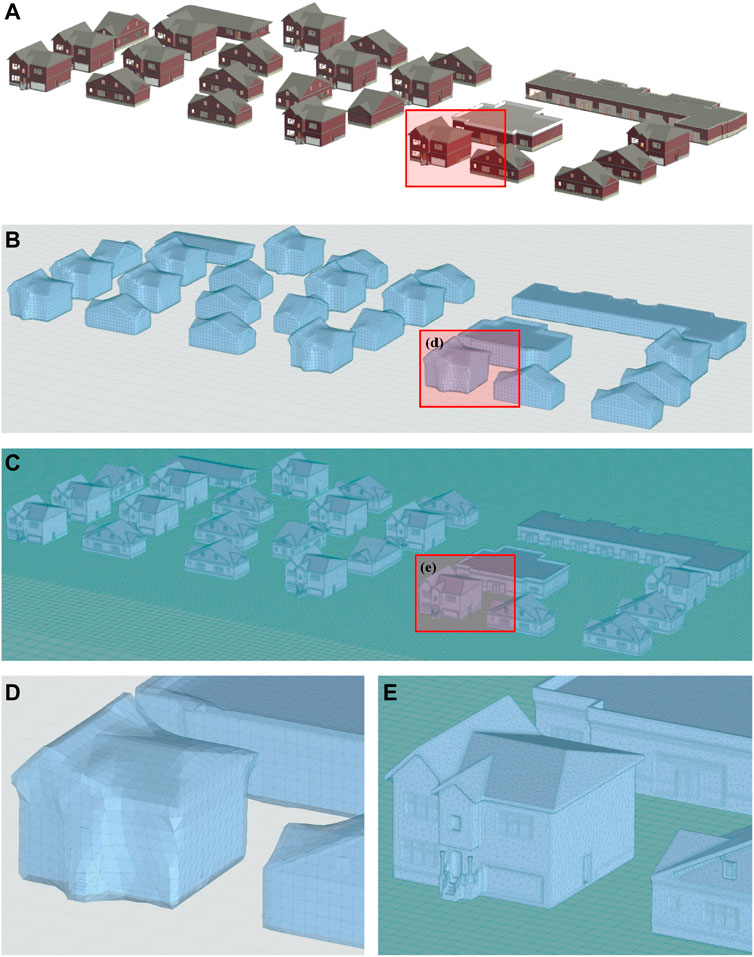
To overcome these research gaps, the output from the developed BIM-GIS integration approach in terms of the 3-D geometry of the community was used as an input for a CFD-based digital wind tunnel that accounts for the aerodynamics interference based on the provided geometry as shown in Image 5A for a small example portion of a community consisting of 25 buildings with different typologies.
This was done by converting the 3-D BIM model of the community to the Industry Foundation Classes (IFC) extension to be used as an input geometry to any computational environment that supports the IFC extension. The BIM model of the community in terms of the IFC extension was then used as an input for a digital wind tunnel using RWIND ( RWIND 3 ) which is an OpenFOAM-based computational environment that allows 3-D incompressible wind flow analysis.
The digital wind tunnel dimensions of the intake size are set to twice the width and height dimensions of the model. Jeho délka je nastavena jako trojnásobek délky modelu s kratší vzdáleností na straně vstupu. Metoda použitá pro výpočet výchozích rozměrů větrného tunelu zahrnuje složitý testovací proces, který byl optimalizován. The default dimensions are determined as to provide sufficiently large free space around the structure in the model and set as small as possible to obtain short calculation times.
The generated aerodynamics interference model by RWIND was verified with experimental wind tunnel data and the verification example can be found herein ( Proudění okolo jednoduché skupiny budov ). However, the shortcomings of RWIND are that it does not allow time-dependent wind simulation with varying wind speed at the boundary condition location.
Also, for large simulations with more than 10 million elements, the simulation computational time could exceed 3 days. A surface mesh was then developed using RWIND based on the geometry using different mesh sizes where mesh dependency is fully checked using the RWIND mesh generator as shown in Images 5B,C. Close-up views of the mesh developed for the generated geometry are shown in Images 5D,E.
The generated mesh for the high-resolution model using the small mesh size in Image 5E was used as input for an OpenFOAM-based numerical solver using RWIND to calculate wind flow and surface pressure at the mesh nodes and then the results were extrapolated for the entire model. The developed CFD model conducted steady flow calculations with 500 iterations and conversion criteria of P-residual = 0.001.
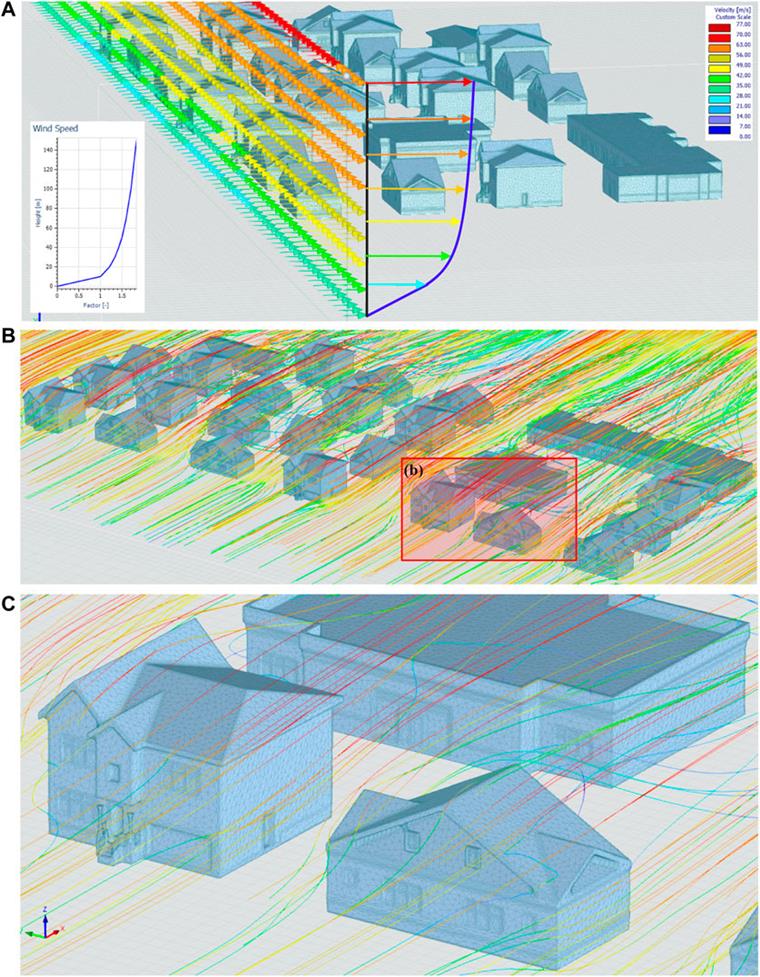
The turbulence model used for the steady flow is RANS k-epsilon and the turbulence intensity (I) is assumed to be 1%. The turbulence model used for the transient flow is LES Spalart-Allmaras Delayed Detached Eddy Simulation (DDES). The inflow turbulence has not been considered in this study since it is out of the scope of the main objectives of this study but can be a point of future work. Image 5A shows the digital wind tunnel using RWIND and the boundary conditions in terms of the wind speed value and the wind speed profile.
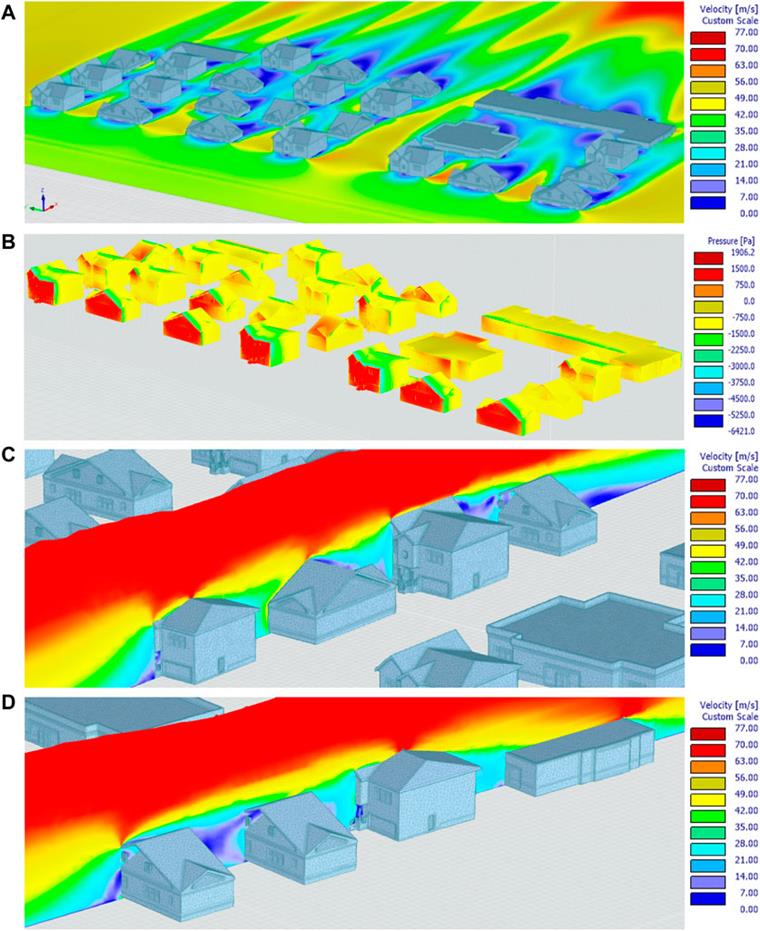
The resulting wind flow across the community model is shown in Image 6B and a close-up view is shown in Image 6C. The analysis results also include the spatial variation of wind speed across the community given the constant wind speed at the boundary condition location as shown in Image 7A and the surface pressure at each building as shown in Image 7B. Images 7C,D shows the wind profile at two different locations across the community.
It should be noted that these results are the wind pressure from the RANS steady flow simulation. The approach described herein could be expanded to investigate large-scale communities with hundreds of buildings, but the method is presented here for a subsection of a community as an example.
3. Example Community: Mexico beach, Florida
Geographical Location
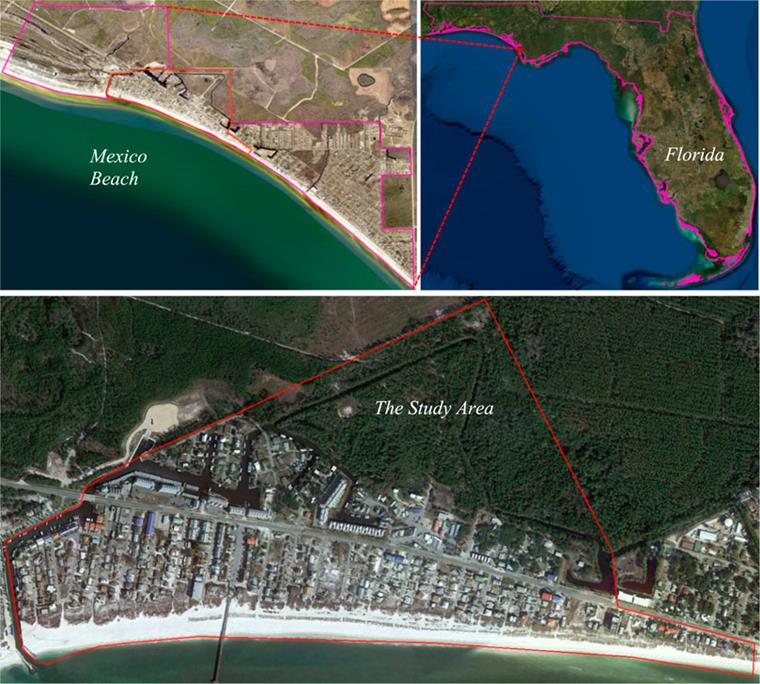
The new methodology was applied to Mexico Beach, FL to show the feasibility and applicability at a larger spatial scale. Mexico Beach is a small coastal community in northwest Florida with a total population of 1,072 people according to the 2010 Census.
Mexico Beach was selected to be a testbed because of its location on the Atlantic Ocean which makes it vulnerable to coastal hazards; specifically, hurricanes. Image 8 shows the spatial location of Mexico Beach with respect to the state of Florida. In this study, only the middle part of Mexico Beach was considered for the wind load analysis as shown in the close-up view in Image 8.
Hazard Scenario: Hurricane Michael 2018
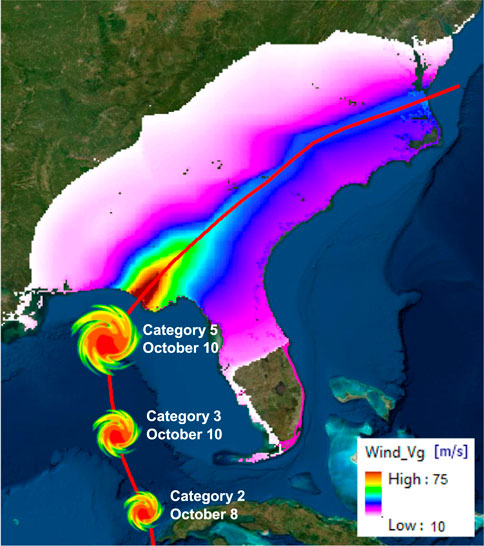
The hazard scenario used for this study is Hurricane Michael in 2018 which is considered the first Cat five storm to strike the US since Hurricane Andrew in 1992. There are 74 confirmed deaths attributed to Hurricane Michael with an estimated $25 billion in losses. Hurricane Michael is the third most intense Atlantic hurricane to make landfall in the US. Hurricane Michael reached Category five status with a peak wind speed of 160 mph just before making landfall near Mexico Beach, Florida on 10 October 2018.
A wind field model was developed for hurricane Michael by RMS and Moody’s Analytics (RMS: Moody’s Analytics Company, 2018) as shown in Image 9. This wind field hazard map shows the most exposed locations in Florida. However, the pixel size used to develop this hazard map is 5.0 km by 5.0 km which means that all buildings in Mexico Beach were exposed to the same wind speed of 160 mph (70 m/s). This wind speed was used as a boundary condition for the digital wind tunnel which will be discussed in detail in the next section.
4. Výsledky
The BIM-GIS integration approach developed in this study was used to model the buildings within the study area of Mexico Beach, FL. The geometry of the community that was generated using the methodology described herein was used as input for a digital wind tunnel using RWIND to account for the wind velocity and wind pressure on buildings. The analysis results are illustrated in the subsequent subsections.
Community Modeling Results
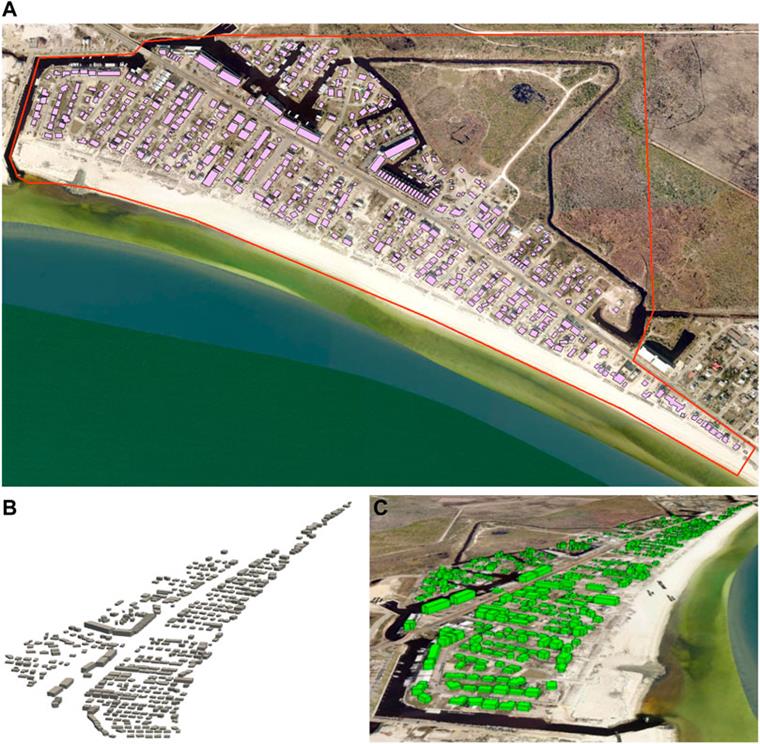
The building footprints from the shapefile for Mexico Beach, FL are shown in Image 10A and were used as input for the BIM-GIS integration approach to develop a 3-D geometry of the community. The only details available for these buildings were their location, footprint shape, and the number of stories.
This information was used to generate the BIM model for each building within the community assuming that all buildings have a flat roof on a slab-on-grade foundation since there is no information about the roof shape or the foundation type as shown in Image 10B. The BIM-Model of the community was georeferenced to be integrated into a 3-D GIS environment as shown in Image 10C. The new BIM-GIS integration approach can be extended to model other information about buildings including roof shape and foundation type.
If this data is available, the algorithm can be adjusted to handle this information in the input data from the community shapefile. The required time to create the community model depends on the availability of data (buildings shapefile) and how much work is needed to prepare the data for the BIM-GIS integration process. The BIM-GIS integration algorithm takes from 2 to 5 min to generate the BIM model of the community depends on the size of the community.
Wind Hazard Modeling Results
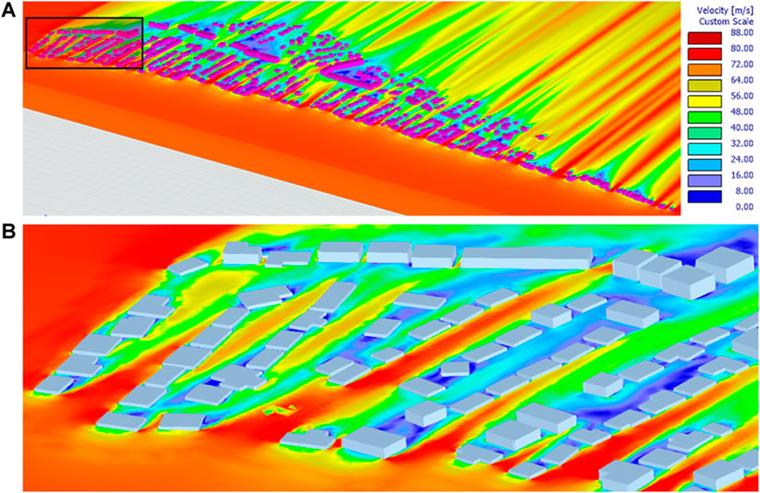
The geometry generated for the community from the BIM-GIS integration approach was used as an input for the digital wind tunnel model using RWIND. More than 10 million elements were used to develop the mesh for the community-level aerodynamics interference modeling. The level of mesh refinement used to generate this CFD simulation enables the model to capture the wind flow across the buildings within the community.
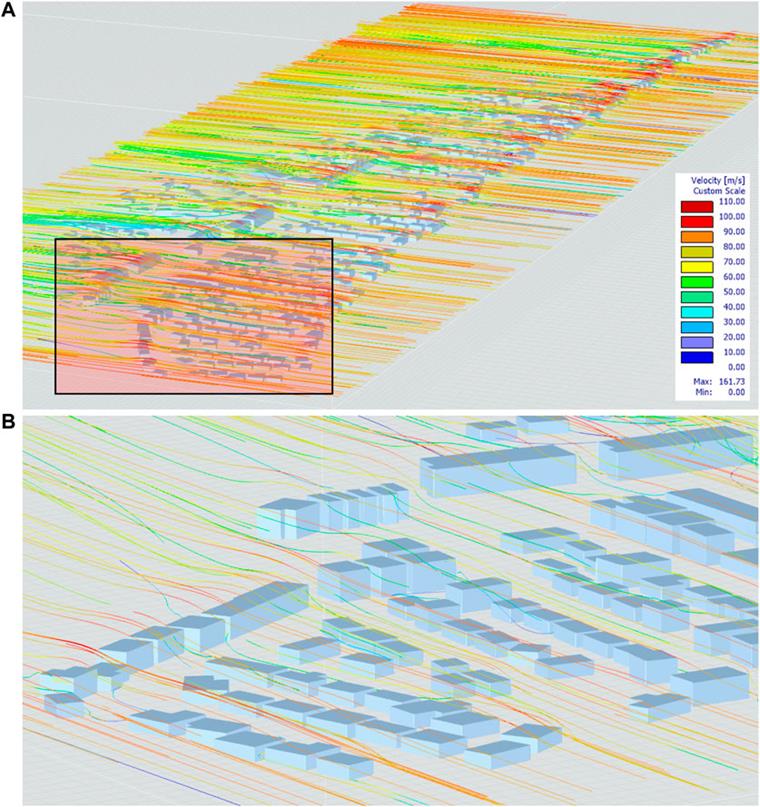
Image 11 shows the output from the digital wind tunnel in terms of the wind flow generated with the spatial distribution of the wind speed across the community. The analysis results show how the wind speed gets decreased as it approaches the buildings where it approaches zero since the wind particles come to a stop at the building location. Image 11 also captures how the wind speed is increased in the streets between buildings and how the building location and orientation affect the wind speed.
It should be noted that the presented quantitative results are highly influenced by the model assumptions including geometry models and turbulence models and there may be some variation in the output results if different assumptions are adopted.
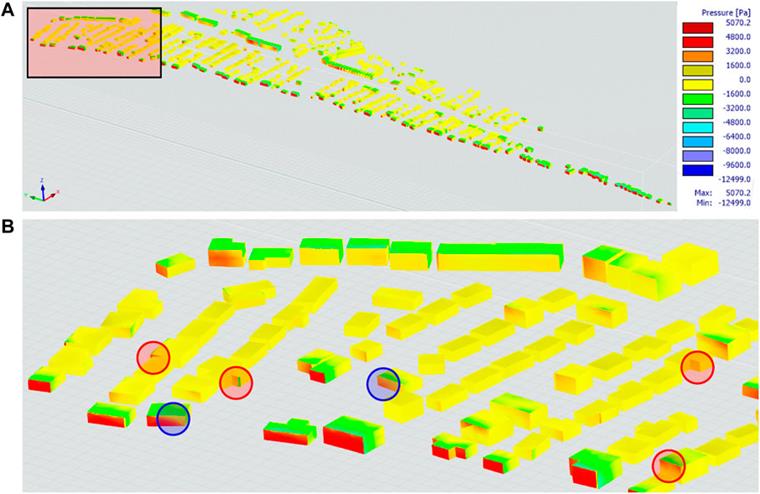
The digital wind tunnel modeling approach allows the wind pressure on buildings to be captured as shown in Image 12. There many observations for the final results from the digital wind tunnel using the proposed approach:
- The analysis results show the significance of the sheltering effect provided by the buildings in the front on the coastline and how it impacts the wind pressure on the buildings in the back.
- The surface wind pressure generated in the numerical wind tunnel shows how the wind pressure transforms from pressure (with a positive sign) to suction (with a negative sign) as shown in Image 12.
- It demonstrates how taller buildings have significantly more pressure on the non-sheltered part with respect to the sheltered part. This is clear from the change in the color of the surface wind pressure as shown in the red-circled locations in Image 12B.
- The analysis results also provide values for the pressure at each side of the building which provide the information needed for a wind damage analysis for each exposed component of the building.
- The orientation of the building and its angle with respect to the wind direction significantly affects the distribution of wind pressure on the building envelope as shown in the blue-circled locations in Image 12B.
- The wind pressure results will allow high-resolution damage analysis at the component-level for each building within the community.
- The analysis results provide an interactive wind flow simulation that shows the spatial variation of the wind flow and the subsequent variation in wind speed as shown in Image 13. This behaves, as one would expect, like a physical wind tunnel that produces wind flow lines interacting with the built environment.
5. Summary and Conclusion
A novel approach was developed to integrate BIM and GIS to generate high-resolution geometry of communities to be used as an input for community-level hazard modeling. The approach developed uses the GIS community model shapefile which has detailed information related to each building within the community such as building footprint, number of stories, etc. The more building details provided in the shapefile, the higher the resolution of the generated community model.
An algorithm was developed to transform the provided information about buildings into a BIM model for the entire community. Then, the geometry generated was transformed into an IFC extension to be used as an input for hazard modeling. One of the applications of the new BIM-GIS integration approach is to use the 3-D community model that is generated as input for a digital wind tunnel to run CFD analysis to account for the aerodynamics interference at the community-level.
The outputs from the digital wind tunnel analysis show how significant it is to account for aerodynamics interference at the community-level and how this could impact the wind speed across the community. It also shows how the sheltering effect could alter the wind pressures on the buildings located behind other buildings near the shoreline. The digital wind tunnel enables detailed wind pressures at each component within the building which can be useful for damage analysis at the component level.
For future research, the new BIM-GIS integration model could also be used to develop geometry to study fluid-structure interaction for other hazards such as floods and tsunamis. The output from the aerodynamics interference model at the community-level can be used as input for high-resolution wind damage analysis using the calculated wind pressures at the building-level. This will provide more accuracy for community-scale damage estimation which is key to risk and resilience analyses.
This work can also be used to develop high-fidelity time-dependent wind-born debris models after tracking the volume of the generated debris from the damaged buildings. Similarly, this model can allow better tracking of wind-rainfall intrusion to accurately capture the variation of the amount of water ingress over time given the damage state of the buildings.
Finally, this new approach is believed to represent the next generation in high-resolution wind hazard models that can allow better tracking of building damage and thereby better risk-informed decisions.
Autoři
Omar M. Nofal
Department of Civil and Environmental Engineering, Florida International University, Miami, FL, United States.
John W. van de Lind
Department of Civil and Environmental Engineering, Florida International University, Miami, FL, United States.
Ahmed Zakzouk
Institute of Construction Informatics, Faculty of Civil Engineering, Technical University of Dresden, Germany.