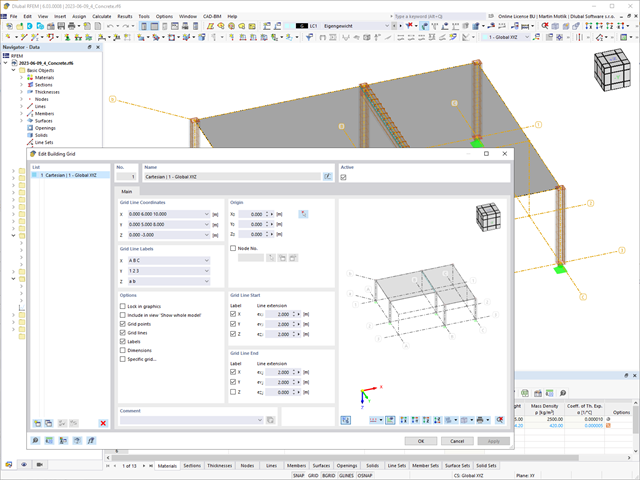
The "Building Grid" guide object supports you in the design of your structure. It features intuitive grid coordinate input and grid line labeling.
You can quickly place grids in space and label them by specifying a graded coordinate code. The grid line end modification allows you to optimize the grid appearance. Furthermore, a preview helps you to define the building grid.
Go to Explanatory Video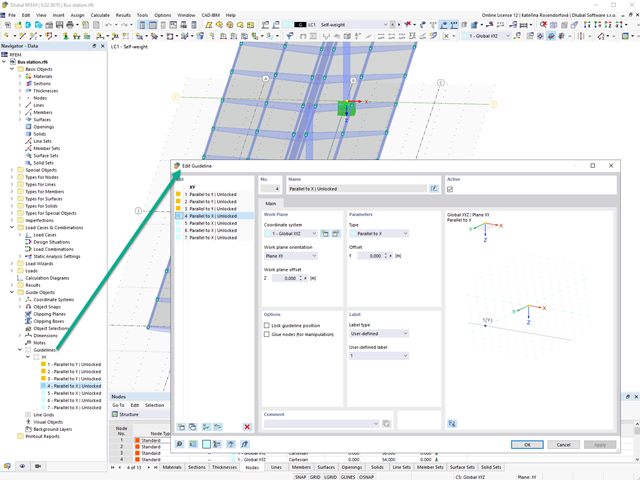
Create guidelines with or without a description for the display of a building grid! You can lock the guideline position to prevent accidental movement of them, for example.
Furthermore, you can glue the guidelines to nodes in order to move the glued nodes as well. That makes your work a lot easier!
Go to Explanatory Video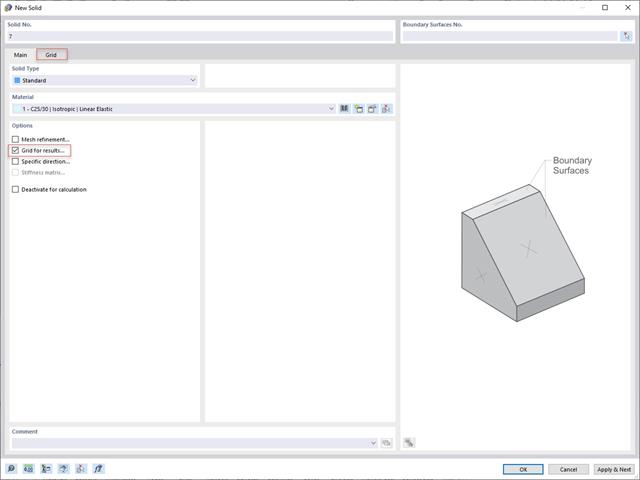
In addition to the "Mesh Refinement" and "Specific Direction" options for solids, you can also activate the "Grid for Results" option, which allows for organizing grid points in the solid space. Among other things, the center of gravity can be set as the origin. There is also the option to activate or deactivate the visibility of the grid for numerical results in "Navigator – Display" under Basic Objects.
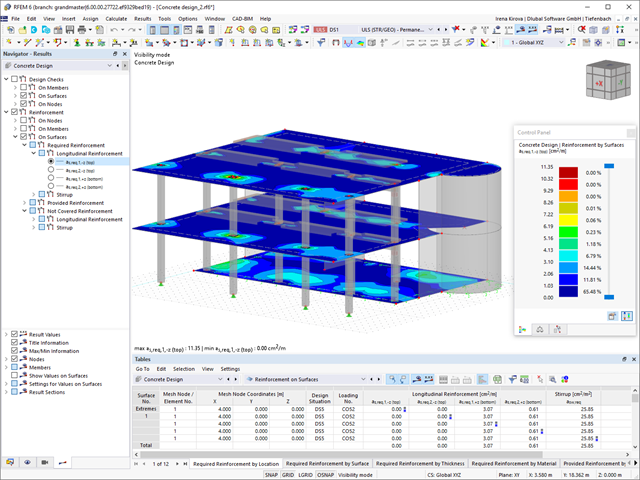
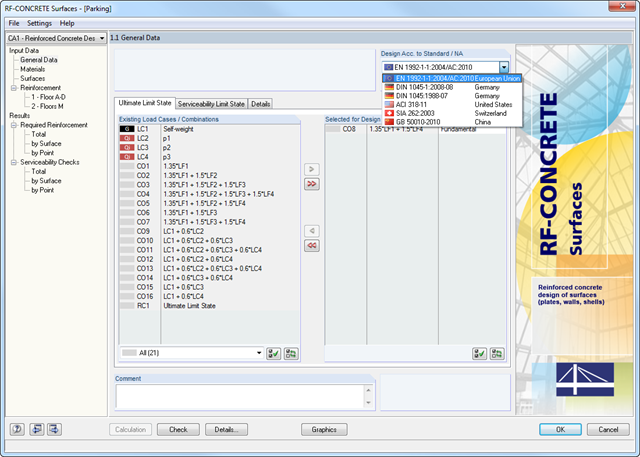
- Free definition of two reinforcement layers
- Design alternatives to avoid compression or shear reinforcement
- Design of surfaces as deep beams (theory of membranes)
- Option to define basic reinforcements for top and bottom reinforcement layers
- Free definition of provided surface reinforcement
- Result output in points of any selected grid
- Design with design moments at column edges
- Determination of deformation in state II; for example, according to EN 1992‑1‑1, 7.4.3, and ACI 318‑19 24.2.3, Table 24.2.3.5
- Considering tension stiffening
- Considering creep and shrinkage
- Fatigue design according to EN 1992‑1‑1, Chapter 6.8 (see this Product Feature)
- Design of a shear joint between the web and flange of ribs
- Optional pure slab or wall design of surfaces for a 2D model type
- Precise breakdown of reasons for failed design
- Design details of all design locations for better traceability of reinforcement determination

There are various tools, such as the object snap, user‑defined input grids, and guidelines, that facilitate the graphical input of structural data. Import DXF files as a line model in order to use specific snap points.
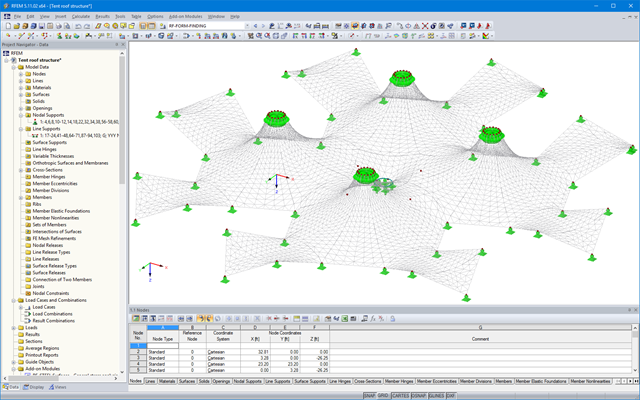
The results of the form‑finding process are a new shape and corresponding inner forces. The usual results, such as deformations, forces, stresses, and others can be displayed in the RF‑FORM‑FINDING case.
This prestressed shape is available as the initial state for all other load cases and combinations in the structural analysis.
For more ease when defining load cases, the NURBS transformation can be used (Calculation Parameters/Form-Finding). This feature moves the original surfaces and cables into position after form‑finding.
By using the grid points of surfaces or the definition nodes of NURBS surfaces, free loads can be situated on selected parts of the structure.
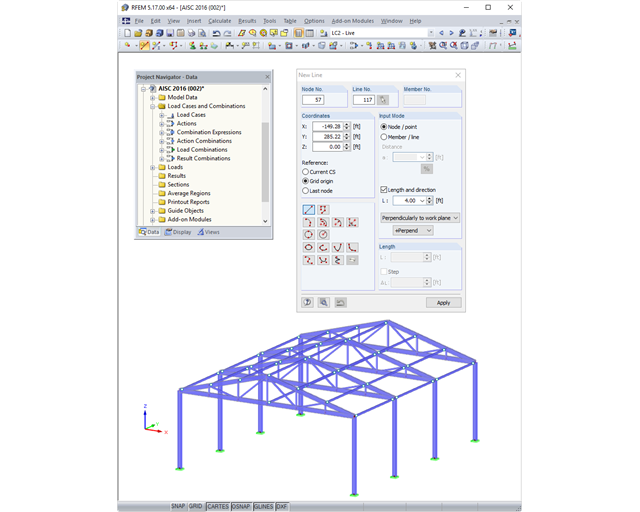
There are various tools such as the object snap, user‑defined input grids, and guidelines, that facilitate the graphical input of structural data. DXF files can be imported as line models or used as a layer in the background in order to use specific snap points.
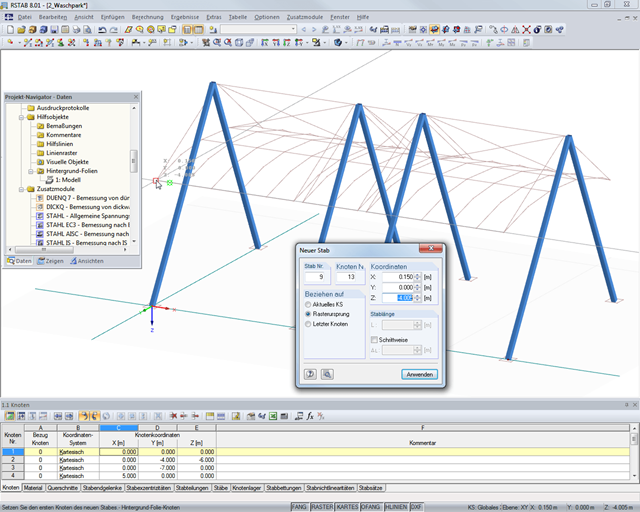
There are various tools such as the object snap, user‑defined input grids, and guidelines, that facilitate the graphical input of structural data. DXF files can be imported as line models or used as a layer in the background in order to use specific snap points.
- Free definition of two or three reinforcement layers in the ultimate limit state
- Vectorial representation of the main stress directions of internal forces allowing optimal orientation adjustment of the third reinforcement layer to the actions
- Design alternatives to avoid compression or shear reinforcement
- Design of surfaces as deep beams (theory of membranes)
- Option to define basic reinforcements for top and bottom reinforcement layers
- Definition of designed reinforcement for serviceability limit state design
- Result output in points of any selected grid
- Optional extension of the module with nonlinear deformation analysis. The calculation is performed in RF‑CONCRETE Deflect by reducing the stiffness according to the standard, or in RF‑CONCRETE NL by the general nonlinear calculation determining the stiffness reduction in an iterative process.
- Design with design moments at column edges
- Precise breakdown of reasons for failed design
- Design details of all design locations for better traceability of reinforcement determination
- Export of isolines for the longitudinal reinforcement in a DXF file for further use in CAD programs as a basis for reinforcement drawings
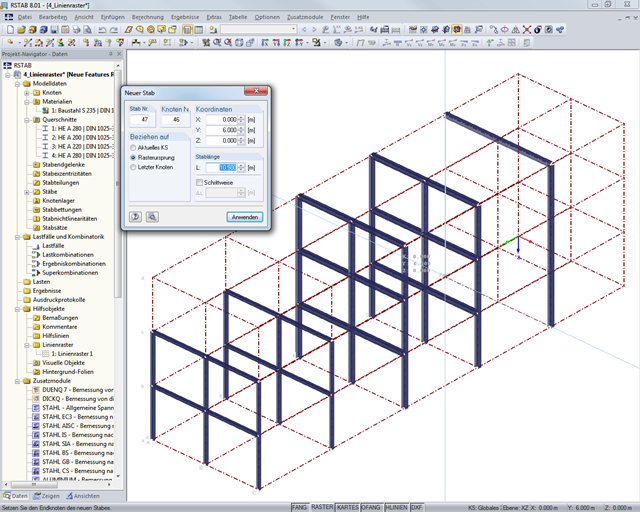
The fast creation of a line grid in the Cartesian coordinate system is now possible. This can optionally be labeled and dimensioned. Furthermore, you have the option to create spherical or cylindrical grids.
The grid can be rotated about one or more axes. The settings for the line grid can be saved and imported again later.
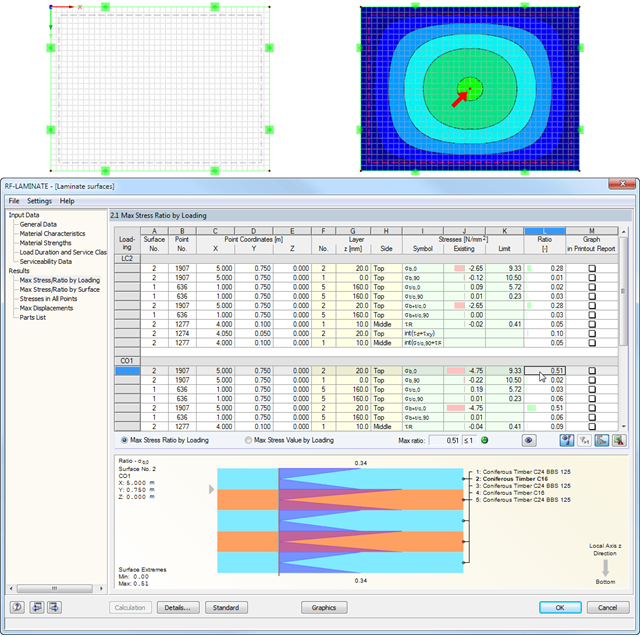
After the calculation, the maximum stresses, stress ratios, and displacements are displayed by load case, surface, or grid points. The design ratio can be related to any kind of stress type. The current location is highlighted by color in the RFEM model.
In addition to the result evaluation in tables, it is possible to display the stresses and stress ratios graphically in the RFEM work window. For this, you can adjust the colors and values assigned in the panel.
.png?mw=640&hash=34966a7f3c34f6b7bb83003f1c13cb57a2f0cabb)
- Realistic representation of interaction between a building and soil
- Extensible library of soil properties
- Consideration of several soil samples (probes) at different locations, even outside the building
- Consideration of groundwater level as well as side effects due to excavation and lowest soil layer being solid
- Calculation of elastic foundation coefficients
- Determination and graphical display of stress diagrams and settlements in grid points