12 Wyniki
Wyświetl wyniki:
Sortuj według:
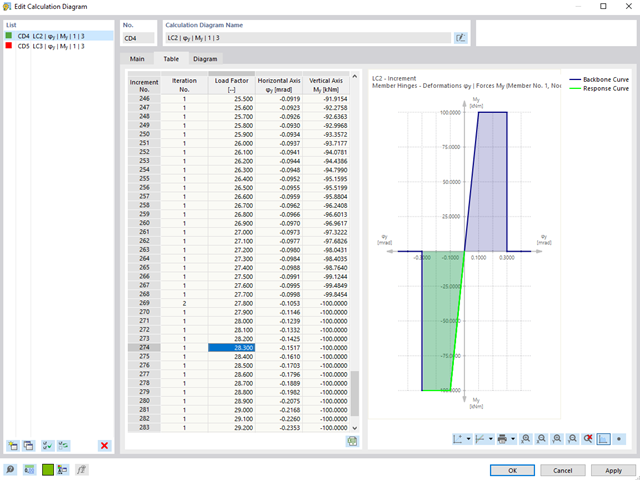
Dla wykresów obliczeń dostępny jest "2D | | Przegub”. Wykresy zwolnień pokazują reakcję przegubu w sytuacjach obciążeniowych.
W przypadku obliczeń z kilkoma sytuacjami obciążenia, na przykład w przypadku analizy pushover i analizy historii czasowej, stan przegubu można ocenić w każdym kroku obciążenia.
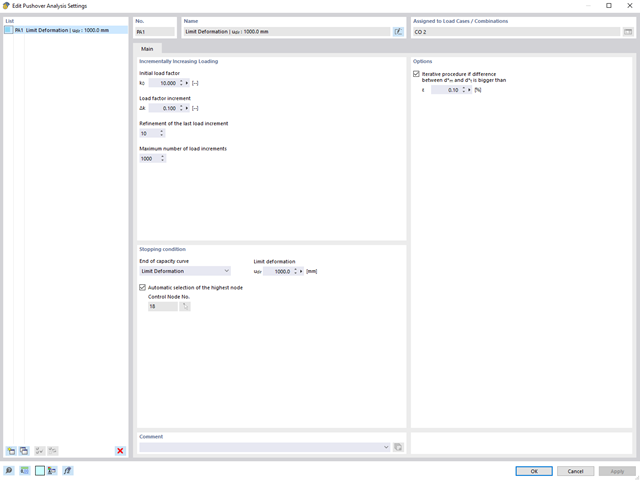
Analiza pushover jest zarządzana przez nowo wprowadzony typ analizy w kombinacjach obciążeń. W tym miejscu można wybrać poziomy rozkład i kierunek obciążenia, obciążenie stałe, żądane spektrum odpowiedzi do określenia docelowego przemieszczenia oraz ustawienia analizy pushover.
W ustawieniach analizy pushover można zmodyfikować przyrost obciążenia poziomego i określić warunek zatrzymania dla analizy. Ponadto użytkownik może bez problemu dostosować precyzyjność iteracyjnego definiowania przesunięcia docelowego.
- Uwzględnienie nieliniowego zachowania komponentu przy użyciu standardowych przegubów plastycznych dla stali (FEMA 356, EN 1998-3) i nieliniowego zachowania materiału (mur, stal - bilinearnie, krzywe robocze zdefiniowane przez użytkownika)
- Bezpośredni import mas z przypadków obciążeń lub kombinacji w celu przyłożenia stałych obciążeń pionowych
- Zdefiniowane przez użytkownika specyfikacje dotyczące uwzględniania obciążeń poziomych (ujednoliconych ze względu na postać drgań lub równomiernie rozłożonych na wysokości mas)
- Wyznaczanie krzywej pushover z możliwością wyboru kryterium granicznego obliczeń (zawalenie lub odkształcenie graniczne)
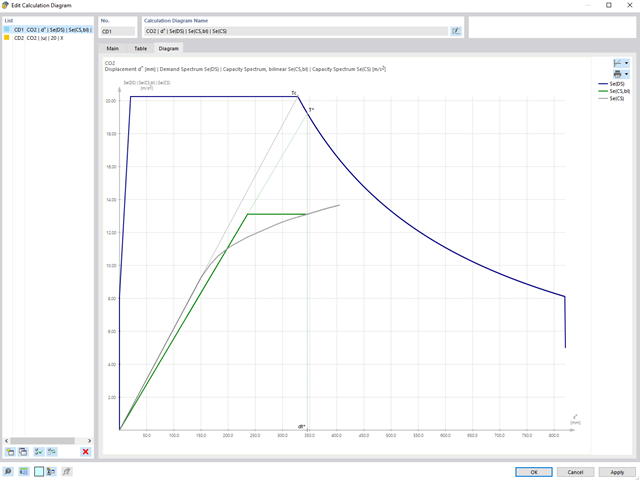
- Transformacja krzywej pushover w spektrum nośności (format ADRS, układ o jednym stopniu swobody)
- Bilinearyzacja spektrum nośności zgodnie z EN 1998-1:2010 + A1:2013
- Transformacja zastosowanego spektrum odpowiedzi w wymagane spektrum (format ADRS)
- Wyznaczanie docelowego przemieszczenia zgodnie z EC 8 (metoda N2 zgodnie z Fajfar 2000)
- Graficzne porównanie nośności i wymaganego spektrum
- Graficzna ocena kryteriów akceptacji zdefiniowanych przegubów plastycznych
- Wyświetlanie wyników obliczeń iteracyjnych docelowego przemieszczenia
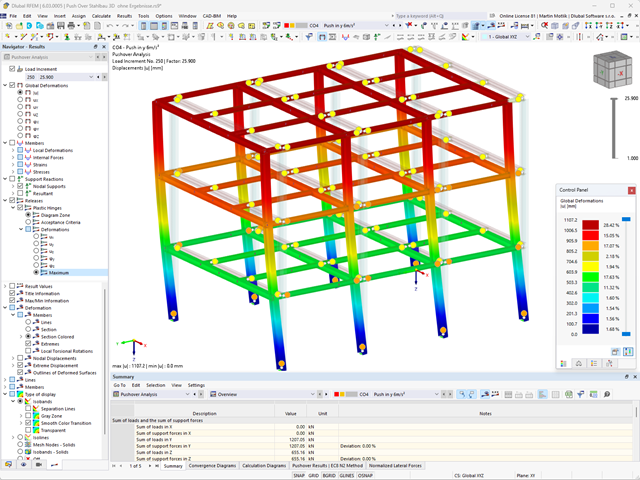
- Dostęp do wszystkich wyników analizy statyczno-wytrzymałościowej w poszczególnych poziomach obciążenia
Podczas obliczeń wybrane obciążenie poziome jest zwiększane w krokach obciążenia. Statyczna analiza nieliniowa jest przeprowadzana dla każdego kroku obciążenia, aż do osiągnięcia określonego warunku granicznego.
Wyniki analizy pushover są obszerne. Z jednej strony konstrukcja jest analizowana pod kątem odkstałceń. Można to przedstawić za pomocą linii siła-odkształcenie układu (krzywa nośności). Z drugiej strony, wpływ spektrum odpowiedzi można wyświetlić w oknie ADRS (Acceleration-Displacement Response Spectrum). Docelowe przemieszczenie jest określane w programie automatycznie na podstawie tych dwóch wyników. Proces można ocenić graficznie oraz w tabelach.
Poszczególne kryteria akceptacji można następnie przeanalizować i ocenić graficznie (dla następnego kroku obciążenia docelowego przemieszczenia, ale także dla wszystkich innych kroków obciążenia). Wyniki analizy statycznej są również dostępne dla poszczególnych kroków obciążenia.
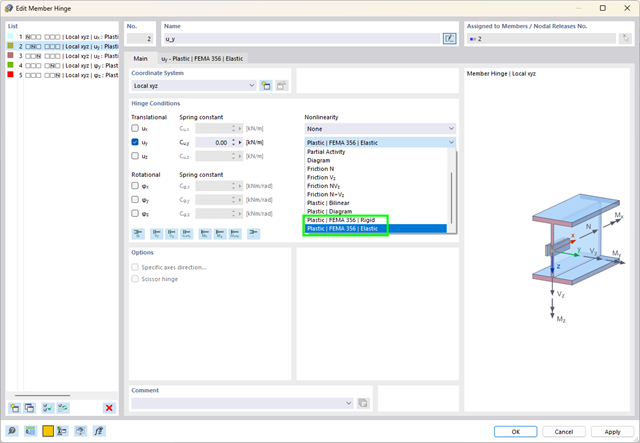
Czym są przeguby plastyczne? Przeguby plastyczne zgodnie z FEMA 356 mogą być używane do tworzenia krzywych pushover. Są to przeguby nieliniowe o wstępnie zdefiniowanych właściwościach plastyczności i kryteriach akceptacji dla prętów stalowych (rozdział 5 FEMA 356).
.jpg?mw=640&hash=26a7c7d3eca4bc6f129e08b373eac4f2314109ba)
Pójdź o krok dalej w projektowaniu konstrukcji. Programy RFEM 6 i RSTAB 9 obsługują teraz nowy format plików do wymiarowania konstrukcji, Structural Analysis Format (SAF). W tym celu obydwa programy umożliwiają zarówno import, jak i eksport. SAF to format pliku oparty na programie MS Excel, który ma ułatwić wymianę modeli do analizy statyczno -wytrzymałościowej pomiędzy różnymi aplikacjami.
.jpg?mw=640&hash=81d73d5501397b910013fb09e66e758eaa32bd62)
Wprowadzono również ulepszenia w wymianie danych, aby ułatwić Państwu pracę. Oprócz importu IFC 2x3 (widok "Coordinate View" i widok "Structural Analysis View"), obsługiwany jest teraz import i eksport IFC 4 (widok "Reference View" i widok "Structural Analysis View").

- Definiowanie naprężeń na przykładzie sprężysto-plastycznego modelu materiałowego
- Wymiarowanie murowych konstrukcji tarczowych na ściskanie i ścinanie na modelu budynku lub na pojedynczym modelu
- Automatyczne określanie sztywności przegubu ściana-płyta
- Obszerna baza danych materiałów o prawie wszystkich kombinacjach kamienia i zapraw dostępnych na rynku austriackim (asortyment jest stale poszerzany, również dla innych krajów)
- Automatyczne określanie wartości materiałów zgodnie z Eurokodem 6 (ÖN EN 1996‑X)
- Możliwość przeprowadzenia analizy pushover
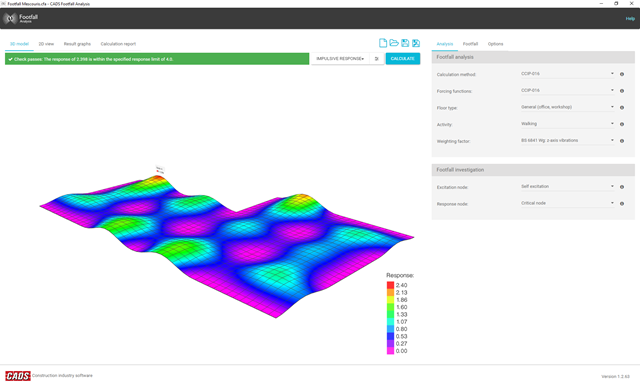
Obliczenia częstotliwości kroków dla każdego rodzaju nieregularnych płyt podłogowych lub schodów wymagają złożonych obliczeń. Footfall Analysis wykorzystuje model RFEM i wyniki analizy modalnej z RF-DYNAM Pro - Natural Vibrations do przewidzenia poziomów drgań we wszystkich miejscach na kondygnacji. Dokładne zbadanie dynamicznego zachowania stropu wymaga dokładnej analizy.
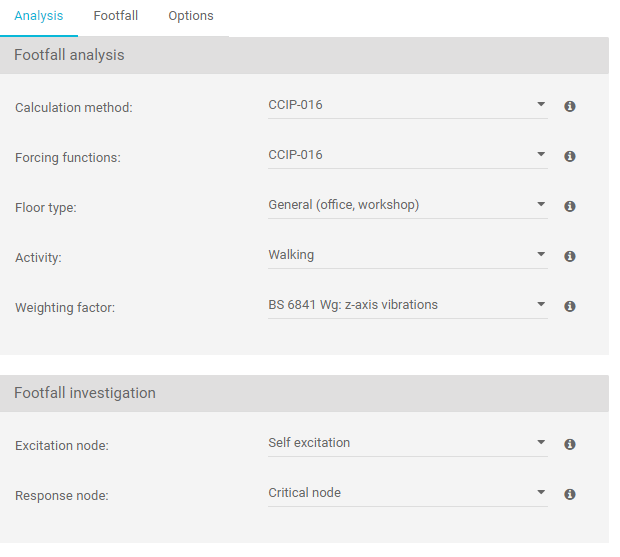
Oprogramowanie wykorzystuje najnowocześniejsze procedury analityczne, dzięki czemu użytkownik może wybrać jedną z dwóch najczęściej stosowanych metod obliczeniowych, a mianowicie metodę Concrete Centre Method CCIP-016) lub metodę Construction Institute Method (P354).
- Analiza Footfall łączy się z programem RFEM, wykorzystując geometrię modelu, dzięki czemu użytkownik nie musi tworzyć drugiego modelu specjalnie do analizy Footfall
- Umożliwia użytkownikowi analizę każdego typu konstrukcji, niezależnie od kształtu, materiału lub zastosowania
- Szybkie i dokładne przewidywanie odpowiedzi rezonansowych i impulsowych (przejściowych)
- Zbiorczy pomiar poziomów drgań – analiza VDV
- Intuicyjne dane wyjściowe, które umożliwiają inżynierowi sugerowanie ulepszeń w krytycznych obszarach w ekonomiczny sposób.
- Ocena przekroczenia wartości granicznych zgodnie z BS 6472 i ISO 10137
- Wybór sił wzbudzających: CCIP-016, SCI P354, AISC DG11 do podłóg i schodów
- Krzywe ważenia częstotliwościowego (BS 6841)
- Szybkie sprawdzenie całego modelu lub określonych obszarów
- Analiza dawki drgań (VDV)
- Regulacja minimalnej i maksymalnej częstotliwości chodzenia oraz wagi pieszego
- Dane wejściowe tłumienia wprowadzane przez użytkownika
- Ustawienie liczby kroków dla odpowiedzi rezonansowej poprzez wprowadzenie danych przez użytkownika lub obliczenie przez program
- Wartość graniczna reakcji środowiskowej w oparciu o BS 6472 i ISO 10137
- Ogólne maksymalne współczynniki odpowiedzi i węzły krytyczne
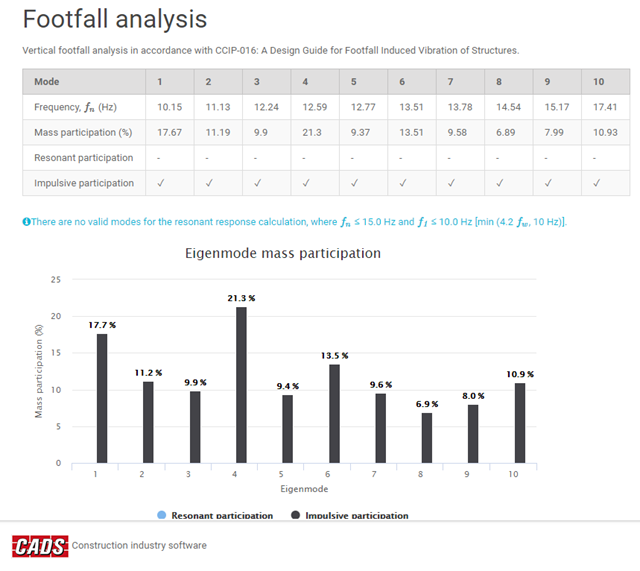
- Analiza rezonansowa (maksymalny współczynnik odpowiedzi, przyspieszenie RMS, węzeł krytyczny, częstotliwość krytyczna)
- Analiza impulsowa (przejściowa) (maksymalny współczynnik odpowiedzi, szczytowe przyspieszenie/prędkość, RMS przyspieszenie/prędkość, węzeł krytyczny, częstotliwość krytyczna)
- Wartości dawki drgań dla analizy rezonansowej i impulsowej
Wykresy
- Współczynnik odpowiedzi a częstotliwość ruchu pieszego
- Udział masy a postacie własne
- Analiza czasowa prędkości
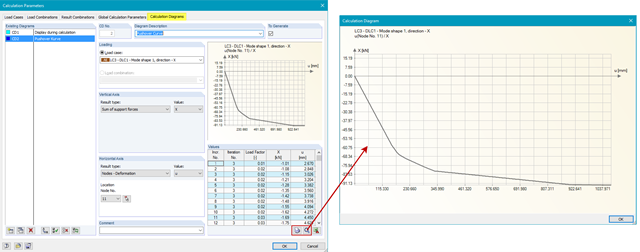
W programie RFEM można definiować krzywe pushover (zwane również krzywymi nośności) i eksportować je do programu Excel.
Moduł dodatkowy RF-DYNAM Pro-Equivalent Loads umożliwia automatyczne generowanie rozkładu obciążenia zgodnie z postacią drgań własnych i eksportowanie go do programu RFEM jako przypadek obciążenia.