In the case of thin-walled structural steel components, the local stability behavior of the cross-section must also be analyzed, in addition to the global stability failure (buckling, torsional buckling, lateral- and flexural-torsional buckling). A distinction is made between two types in EN 1993-1-3 [1]:
- Local buckling: characterized by the plate buckling of individual cross-section parts out of their plane, whereby the cross-section corners are assumed to be fixed by pinned supports. This stability mode is described in EN 1993-1-5 [2] as plate buckling.
- Total panel buckling/distortional buckling: characterized by the instability of the edge stiffening of a cross-section. At the same time, deformations in and out of the plane occur in adjacent cross-section parts.
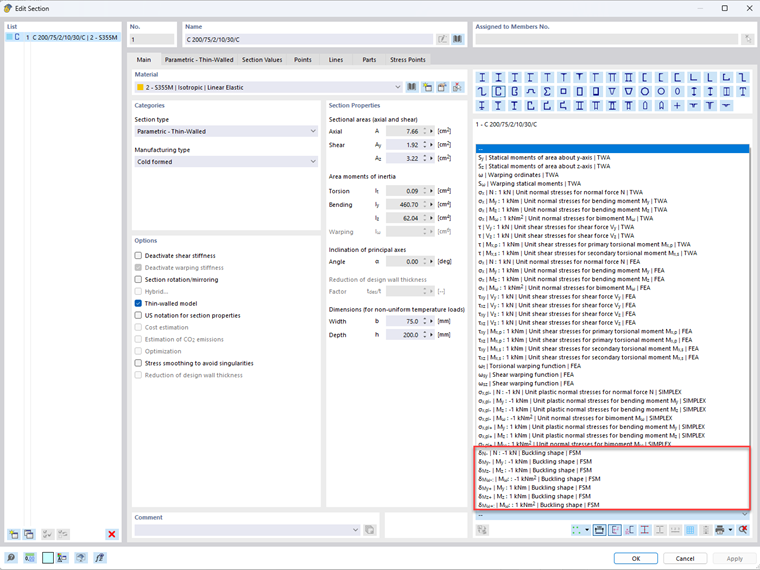
In RFEM 6 and RSTAB 9, the critical load factors and mode shapes for the local stability phenomena mentioned above can be calculated considering the unit loading. This calculation is a linear stability analysis based on the "constrained Finite Strip Method (cFSM)" [3]. The results of the finite strip calculation can be called up for all thin-walled cross-sections in the "Edit Section" dialog box. You can use the drop-down menu below the cross-section icons to select the buckling shapes due to unit loading (Image 1) in addition to the unit stresses and other cross-section functions.
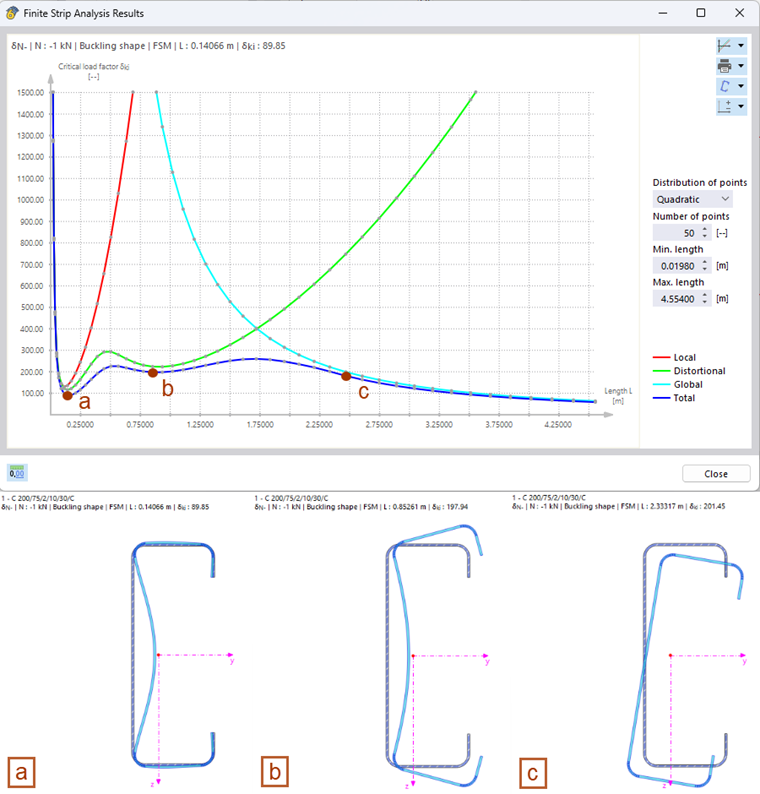
If one of the unit internal forces is selected, the interactive "Finite Strip Analysis Results" diagram opens. The blue graph that is displayed shows the minimum critical load as a function of the corresponding buckling half-wave length. The results can also be shown separately for the different stability modes, which are local buckling, distortional buckling, and global stability failure (assuming a single-span beam with lateral and torsional restraint) (Image 2).
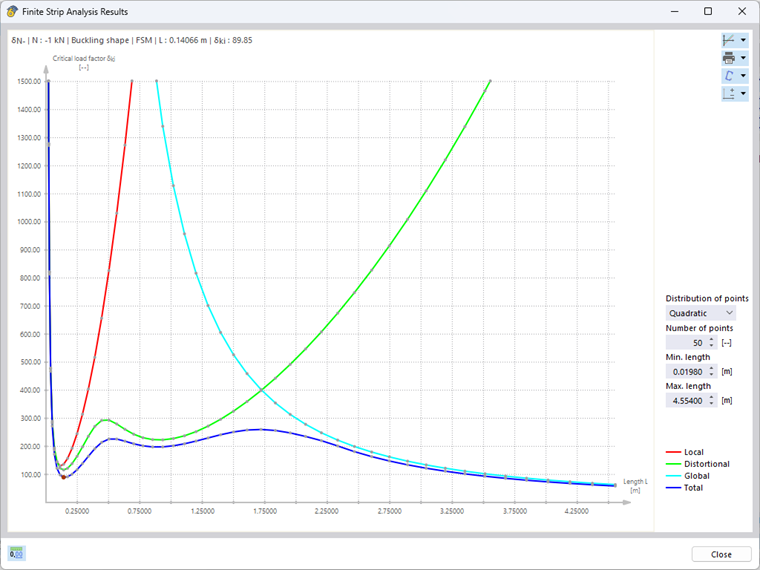
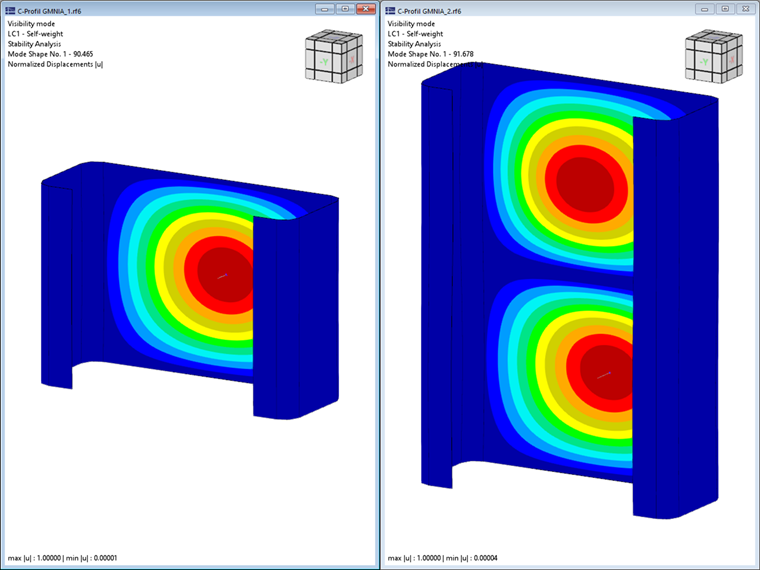
Please note that only the first (single-wave) mode shape of the respective stability mode is taken into account for the stability analysis. However, the determined critical loads also apply to multiples of the related half-wave lengths, which can be shown by means of a comparative calculation using shell elements and the Structure Stability add-on. For the present C-section, having a length of 0.141 m (about 0.46 ft), this results in a critical load of -90.47 kN, which matches very well the FSM result of -89.85 kN (see Image 2). When the length is doubled to 0.282 m (about 0.92 ft), the number of buckles also doubles with a more or less constant critical load (-91.68 kN). Therefore, when determining the governing critical loads of the local stability phenomena (local buckling and distortional buckling), the respective minima of the determined limit curves should always be taken into account.
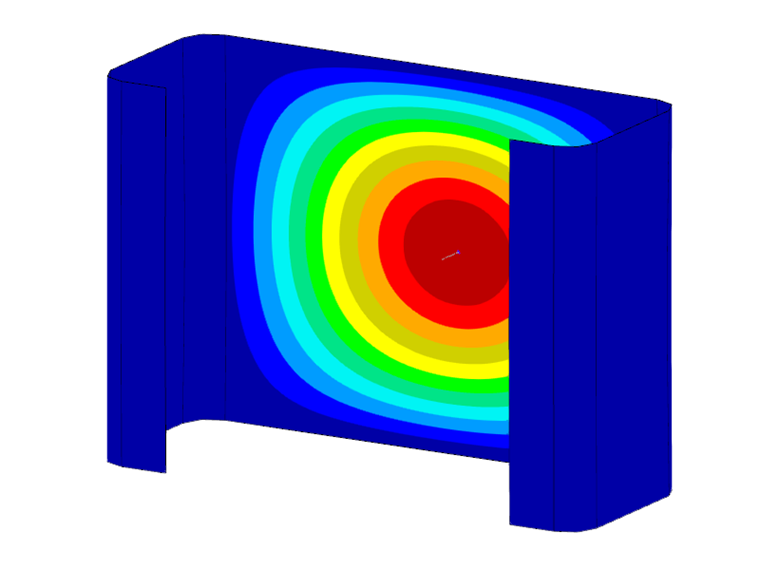
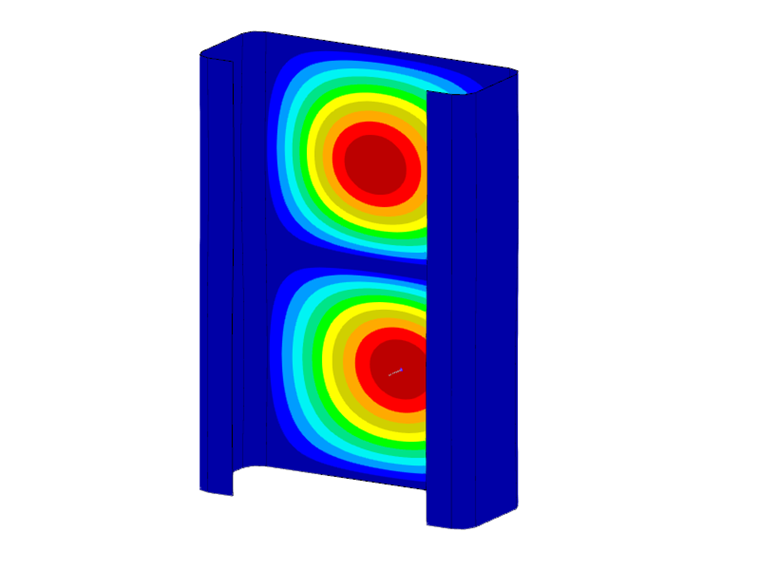
The cross-section deformations associated with a calculated critical load can be seen in the cross-section graphic. By default, the mode shape that belongs to the first local minimum of the critical load curve is displayed. By "clicking" any data point in the diagram, the display is automatically updated. The mode shapes shown in Image 4 clearly show the influence of the respective stability modes on the determined critical load. While the local buckling dominates in point a, the mode shape in point b is characterized by distortional buckling. In point c, however, a rigid body motion of the cross-section can be seen, which is associated with the global stability failure (here, it is lateral and flexural torsional buckling).
The FSM results enable an initial assessment of the stability behavior of slender cross-sections and provide an indication of whether the stability failure is dominated by a local, global, or an interaction of both forms of stability. Moreover, the determined critical load factors can be used to calculate the ultimate load-bearing capacity of slender sections according to EN 1993-1-3 [1] or AISI S100-16 [4].