After the calculation, the maximum stresses and stress ratios are displayed sorted by sections, members/surfaces, member sets, or x-locations. In addition to the tabular result values, the corresponding cross-section graphic with stress points, stress diagram, and values is displayed as well. The design ratio can be related to any kind of stress type. The current location is highlighted in the RFEM/RSTAB model.
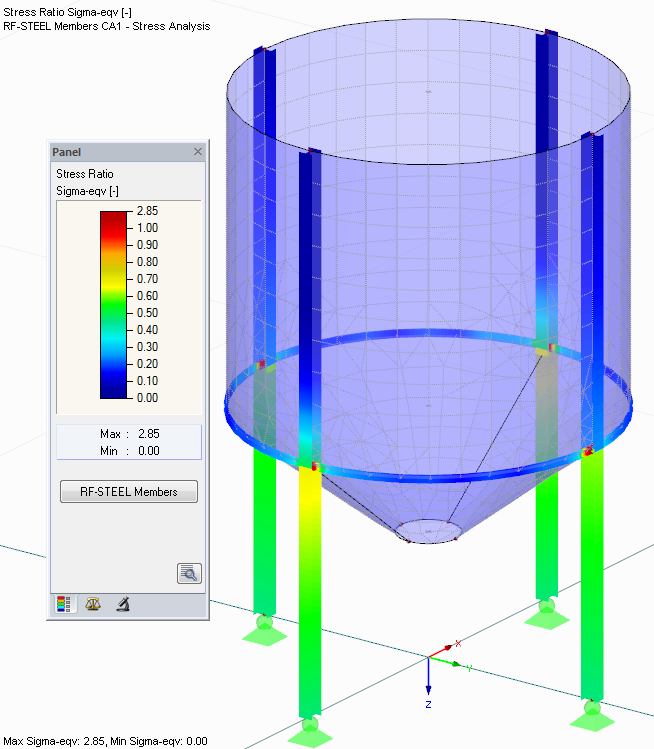
In addition to the result evaluation in the module, it is possible to represent the stresses and stress ratios graphically in the RFEM/RSTAB work window. It is possible to individually adjust the colors and values.
Result diagrams of a member or set of members facilitate targeted evaluation. Furthermore, you can open the respective dialog box of each design location to check the design-relevant section properties and stress components of any stress point. It is possible to print the corresponding graphic, including all design details.