Answer:
By default, only two values (max and min) are displayed on the result diagram of the line supports.
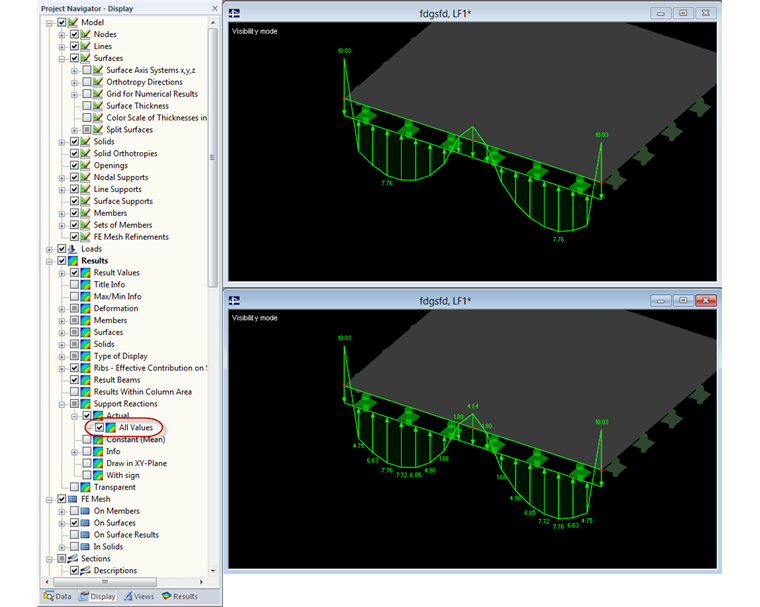
However, you can also use the "Display" navigator to display all values:
"Results" → "Support Reactions" → "Actual" → "All Values"
The distribution depends on the FE mesh, whereby one value is displayed on each FE node.
For example, you can influence the distribution on specific surfaces or lines using an FE mesh refinement. The numerical output in the result table and thus also in the printout report is only controlled by the global FE mesh.