Answer:
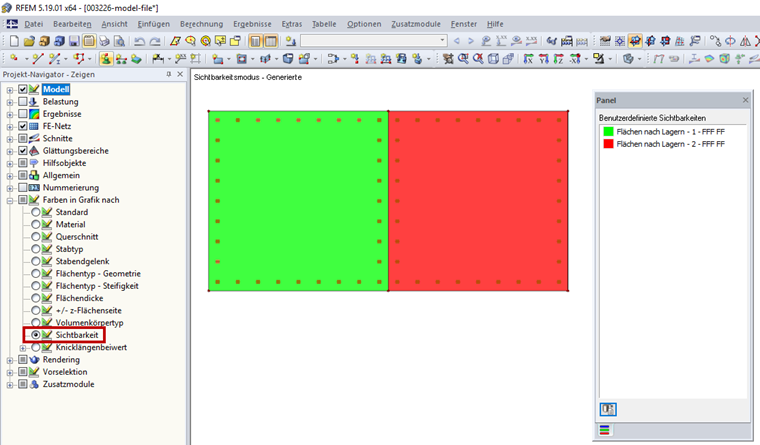
In Project Navigator - Display, select the option Colors in Graphics According to → Visibility (see Image 01).
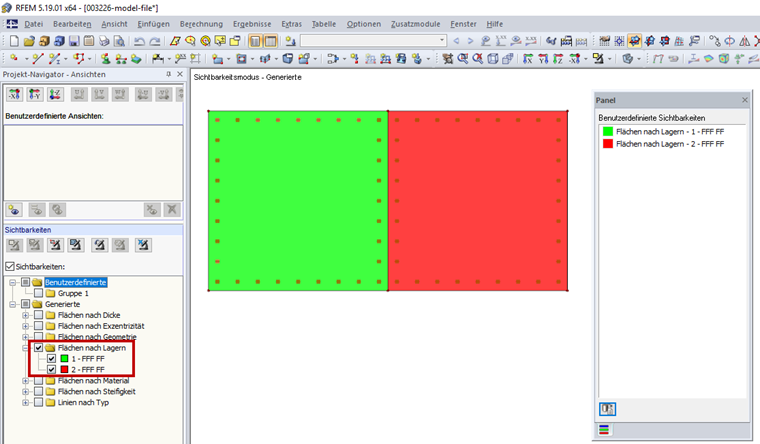
Then, select the visibility for Surfaces by Support in Project Navigator - Views (see Image 02).
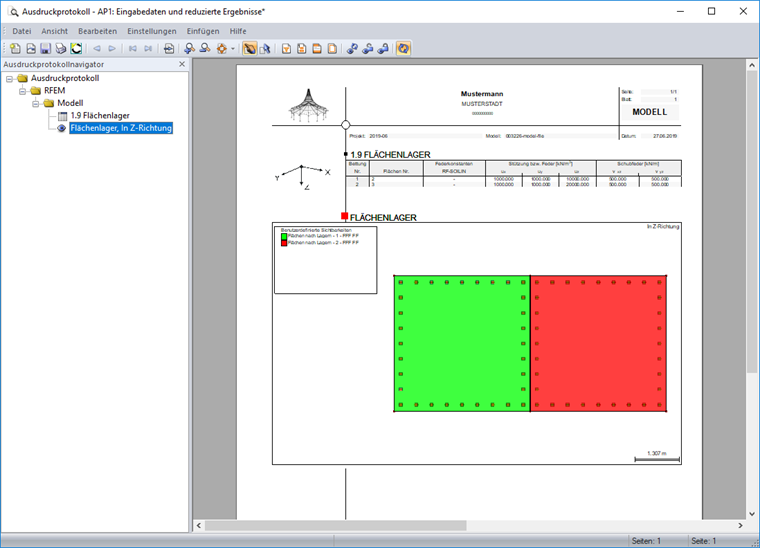
In the printout report, you can then display the table with the surface supports as well as the colored display of the surface supports, including the legend (see Image 03).