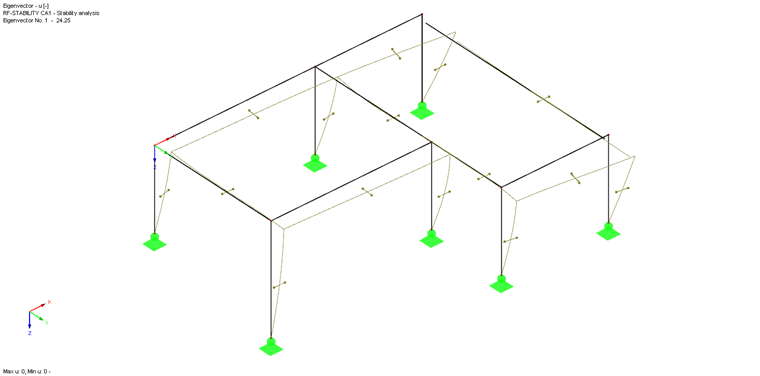
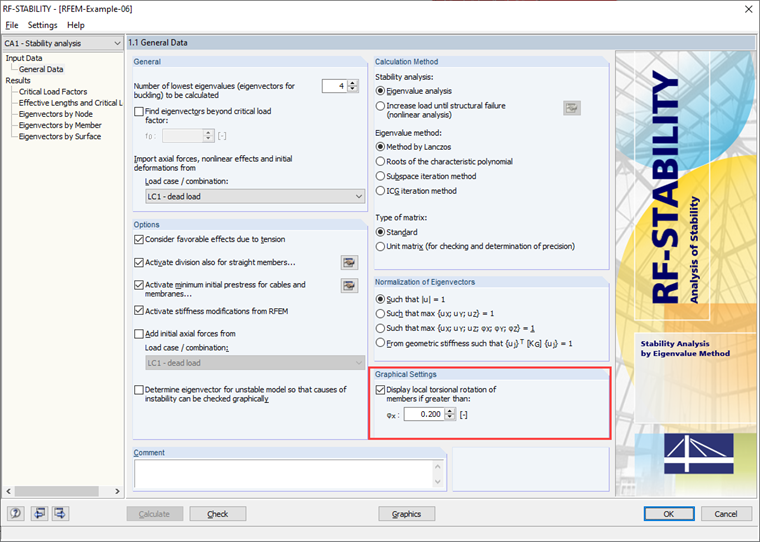
These lines represent the local torsional rotation (see Image 01). By default, only torsional rotations φx with standardized values greater than 0.2 are displayed. This ensures clear arrangement of the graphic. The graphical display is controlled directly in the add-on module (see Image 02).
Displaying Torsional Rotation when Determining Buckling Modes in RF-STABILITY
When determining the buckling modes in RF‑STABILITY, additional lines are displayed for each member perpendicular to the buckling curve. What are they?
Answer:
Author
Gerhard works in product engineering in the field of timber structures and also assists with customer support. He draws on his development experience to create practical and actionable solutions.
;