


Introduction
In structural engineering and material science, plastic strain represents the permanent, irreversible deformation a material undergoes after its yield point has been exceeded. The 5% plastic strain limit (ɛp = 0.05) is a critical benchmark in this transition. It defines a controlled threshold where the material has moved past its "elastic" memory but has not yet reached a point of local buckling or fracture.
Mechanics of 5% Plastic Strain Threshold
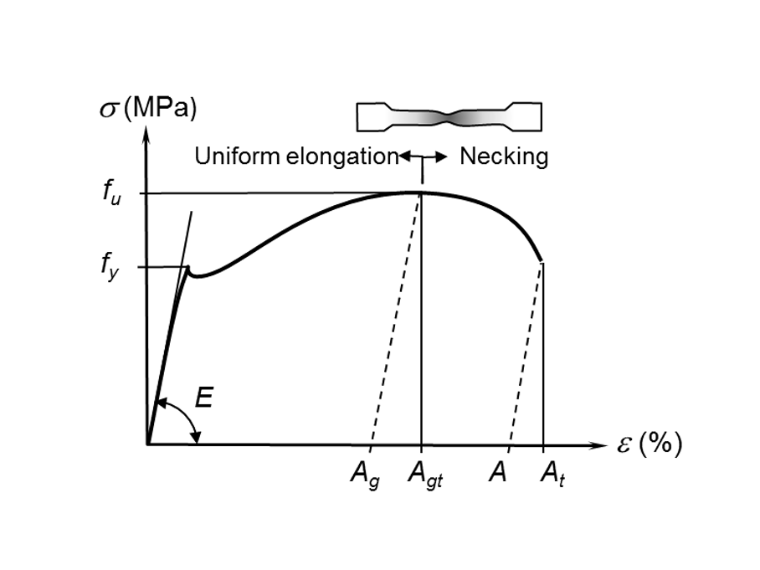
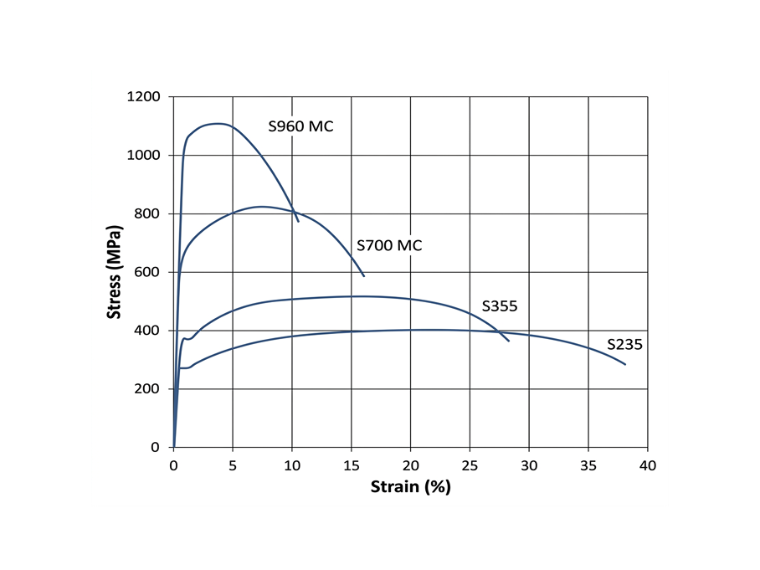
The adoption of a 5% plastic strain limit leverages the metallurgical phenomenon of strain-hardening. Upon reaching the yield plateau, the crystalline structure of the steel reorganizes, providing additional load-carrying capacity as the material approaches its ultimate tensile strength (σu).
The 5% limit represents an optimum design equilibrium: Accordance with the recommendations in EN 1993-1-5 (Appendix C, Paragraph C.8).
- Capacity Maximization: It captures significant strain-hardening reserves, enabling the specification of leaner, more efficient cross-sections.
- Stability Constraints: It ensures structural integrity by remaining below the threshold of severe geometric instability and premature local buckling.
Standards for Ductility
Ductility is the material's capacity for substantial inelastic deformation prior to fracture, fundamentally quantified through percent elongation or area reduction in uniaxial tensile testing. Beyond facilitating fabrication, it serves as a critical safety mechanism by enabling plastic stress redistribution, which prevents localized brittle failure at points of high stress concentration. International standards, notably the Eurocodes (per EN ISO 6892-1), regulate structural ductility via specific performance indices: the tensile-to-yield strength ratio (fu / fy), the ultimate-to-yield strain (εu/εy), and total elongation at failure, the last of which is standardized using a proportional gauge length defined by Lo = 5.65√A.
- Table 1: Ductility Limits for Carbon Steel
| Standard / Authority | Region | Plastic Limit Strain (εpl) | Context & Application |
|---|---|---|---|
| EN 1993-1-5 (Annex C) | Europe | 5% | The most widely cited "de facto" international limit for non-linear FEA of plated structures. |
| AISC 360 (App. 1) | USA | No hard limit | Focuses on stability and "strength" limit states. Practice often defaults to 5% or the strain at the onset of strain hardening. |
Background
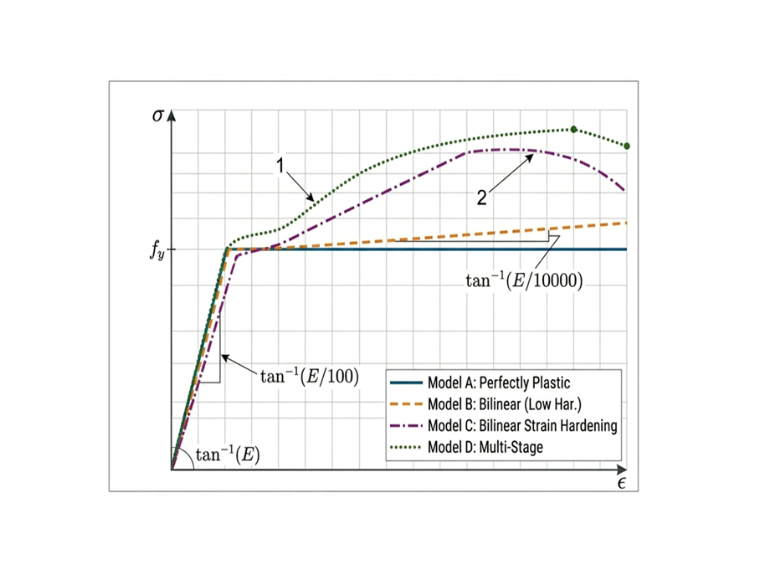
In steel structural design according to Eurocode 3, the material behavior of structural steel is simplified using an idealized bilinear model. This approximation allows engineers to perform plastic analysis and design without the complexity of the full non-linear stress-strain curve.
The structural model discretizes all steel components—including flanges, webs, stiffeners, and haunches—using finite element analysis (FEA). This approach is industry-standard, providing a high degree of numerical reliability for complex geometries. To capture realistic post-yield behavior, plates are assigned an elasto-plastic material model with a nominal hardening slope of E/1000, as specified in EN 1993-1-5, Annex C.6.
Example
Plastic Limit Strain of Notched Structural Steel
This example provides the verification of notched structural steel (S235) by RFEM 6. The plastic behavior of the notched structural steel is evaluated against the design provision of Eurocode 3 and compared with the finite element model RFEM 6.
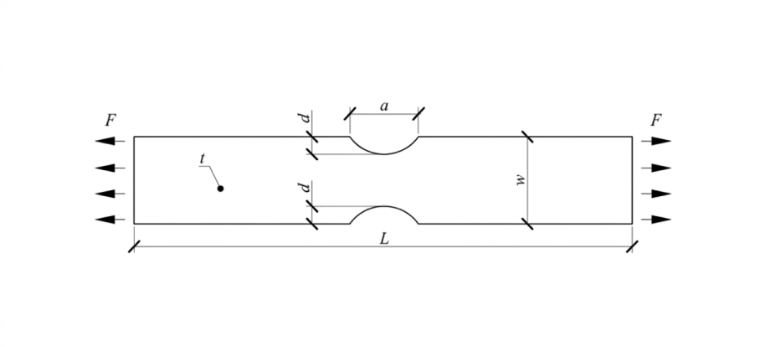
- Table 2: Dimensions of Specimen
| Specimen No. | Plate Dimension (mm) | Notch Dimension (mm) |
|---|
| Width (w) | Length (L) | Thickness (t) | Width (a) | Depth (d) | |
|---|---|---|---|---|---|
| 1 | 40 | 420 | 8 | 20 | 5 |
Material Properties
The standard properties for S235 steel:
E = 210,000 MPa, fy = 235 MPa, fu = 360 MPa, w = 40mm, t = 8 mm, d = 5 mm
Calculation of Net Section Area (Anet)
The notches reduce the total width of the plate at the center. The net width (wnet) is:
wnet= w - 2d = 40.0 - 2(5) = 30 mm
The net cross-sectional area is:
Anet = wnet * t = 30 * 8 = 240 mm2
Plastic Limit Load (Fpl,Rd)
In Eurocode 3, check two primary tension limits. For a specimen with significant notches, the plastic limit is effectively the design plastic resistance of the gross section (Npl,Rd) or the ultimate resistance of the net section (Nu,Rd).
Plastic Resistance of Cross-Section
Assuming the failure occurs at the notch, the design plastic resistance is:
Ultimate Resistance of the Net Section
The formula for net section rupture is:
The plastic resistance capacity according to EC3 is 56.4 kN.
Modeling with RFEM 6
This study utilizes a shell-element numerical model of a notched S235 steel specimen to evaluate plastic strain development. An isotropic bilinear hardening model was implemented to characterize the material’s post-yield behavior. The specific geometric configurations and dimensional parameters of the specimen are detailed in Image 4 and Table 2, respectively. Regarding the boundary conditions, the model was subjected to a fixed constraint at the proximal end.
Discussion
This study investigates the adequacy of the 5% plastic strain limit traditionally utilized in the design of steel structures. Using non-linear finite element analysis (FEA) performed in RFEM 6, the numerical results confirm that while the observed plastic strain remains within the threshold prescribed by EN 1993-1-5 (Annex C), the behavioral nuances of the cross-section warrant further scrutiny.
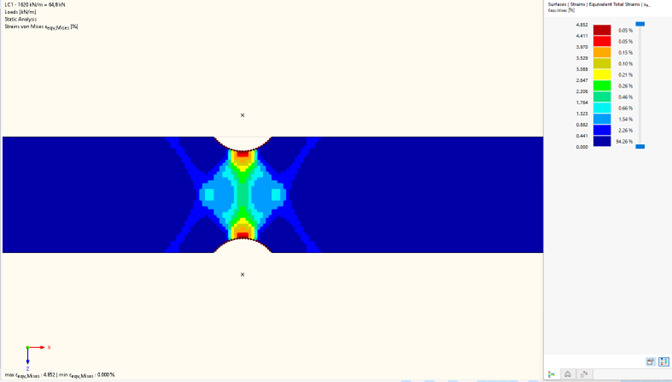
For an 8x30 mm profile subjected to tension, the design plastic resistance (Npl,Rd) calculated according to Eurocode 3 (EC3) is 56.4 kN. In contrast, the FEA model yielded a capacity of 65 kN. This variance is attributed to the inclusion of strain hardening effects in the numerical model once the 5% strain limit is approached. Given that the material enters the strain-hardening regime prior to reaching this limit, the higher resistance value of 65 kN is considered a realistic representation of the member’s capacity nearing rupture, highlighting the potential conservatism inherent in standard design equations compared to advanced numerical simulations. RFEM 6 demonstrates the max εeqv, Mises = 4.85%.
The hand calculation method from EC-3 gives a resistance of 56.4 kN, while the advanced model in RFEM6 gives 65 kN; a difference of about 15%. But why? The EC-3 method uses a simple formula to estimate how much load a steel cross-section can carry. This formula is basically fy × A (the yield strength multiplied by the cross-sectional area), which assumes the steel just reaches its yield point and stops there. No safety factors or correction factors are involved in this particular step; it is straightforward multiplication. The limitation here is that this approach assumes all parts of the cross-section yield at exactly the same moment, and it ignores what happens after the steel first starts to yield.
In reality, steel does not simply stop carrying load when it yields. It continues to deform and redistribute internal forces to other parts of the cross-section—a behavior known as plasticity spreading—and it can even carry slightly more load due to strain hardening. The RFEM 6 model captures all of this behavior step by step, which is why it predicts a higher and more realistic resistance of 65 kN.
In short, EC-3 uses a simplified approach by design; it gives a straightforward estimate based on the point of first yielding. RFEM 6 is more detailed and closer to what the steel actually does under load.
Conclusion
To ensure structural integrity while optimizing material efficiency, a 5% plastic strain limit was established as the primary design threshold. This value is rigorously validated through comparative analysis with 2D shell finite element models in alternative FEA suites, empirical experimental data, and strict adherence to Eurocode recommendations (EN 1993-1-5). By adopting this limit, the model effectively captures the non-linear behavior of the structure, facilitating an economical design without compromising the requisite safety margins.