5 Results
View Results:
Sort by:
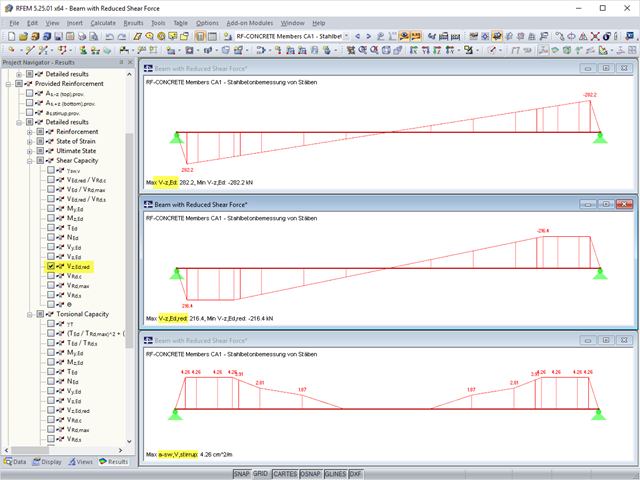
For uniformly distributed loading according to EN 1992‑1‑1 (Eurocode 2), the design section for the shear reinforcement can be placed at the distance d from the front edge of the support. Thus for the shear reinforcement, the applied shear force is reduced to VEd,red. To analyze the maximum design shear resistance VRd,max, however, the total shear force is applied.
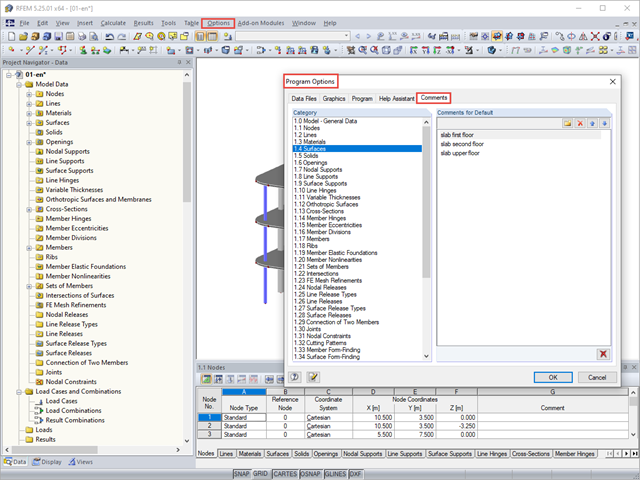
You can assign comments to each element in RFEM and RSTAB (structure element, load element, and so on). This can help to improve the overview and documentation of structures, as the comments appear in the printout report and, for example, certain objects can be filtered and displayed using the "Select Special" function.
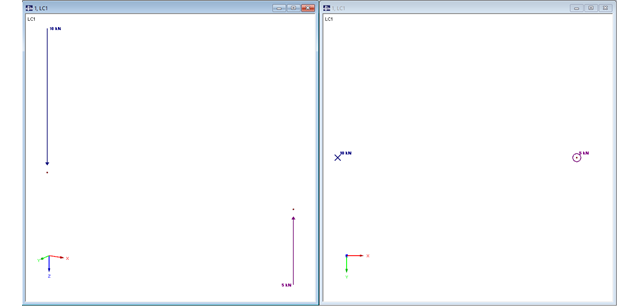
In RFEM, structures can be modeled and analyzed in a spatial environment. The permanent 3D visualization helps you to better understand complex models and to represent the force flux. However, you can switch from a spatial mode to a planar sheet mode in the documentation of a calculation. To do this, you have to describe the spatial calculation of the structure with all the necessary properties on "flat" paper pages for an independent reader. Usually, you try to display the load actions and the corresponding results by using an orthogonal view of the substructure of the entire structure. Obviously, the load symbols depicted in the 3D mode in a view perpendicular to the load become unrecognizable due the missing expansion. In order to still be able to create a clear representation of all information, the corresponding adjustments are available in RFEM.
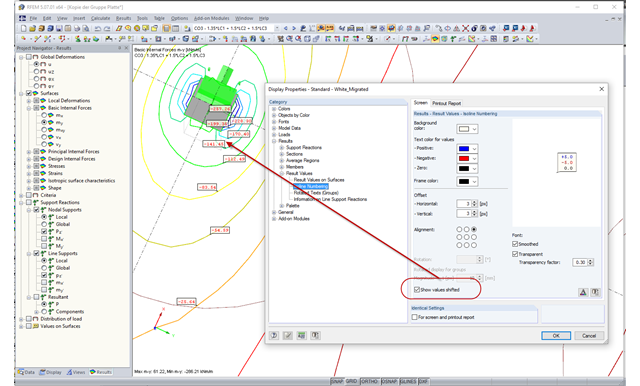
In the case of very small distances between isolines, the labels often overlap, which makes the result documentation difficult. As of RFEM version 5.06, you can select a shifted arrangement of the isoline labels in the Display Properties dialog box. By selecting the "Show values shifted" option, you can easily avoid overlapping the result values in many cases.
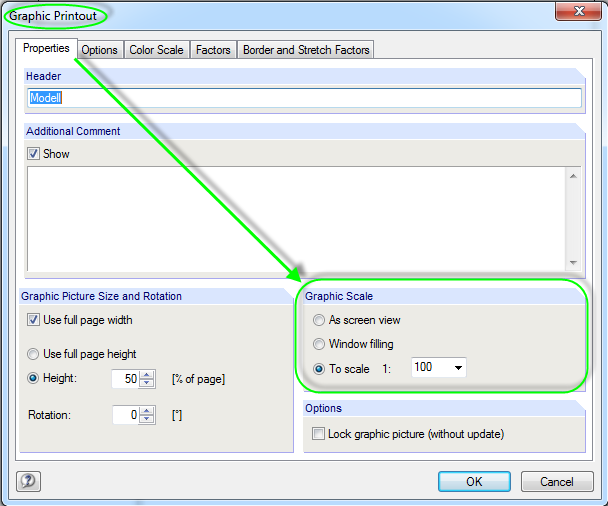
A graphical documentation of the structural analysis results facilitates the result interpretation tremendously. There are various scale options available for printing graphics in the printout report.