21 Results
View Results:
Sort by:
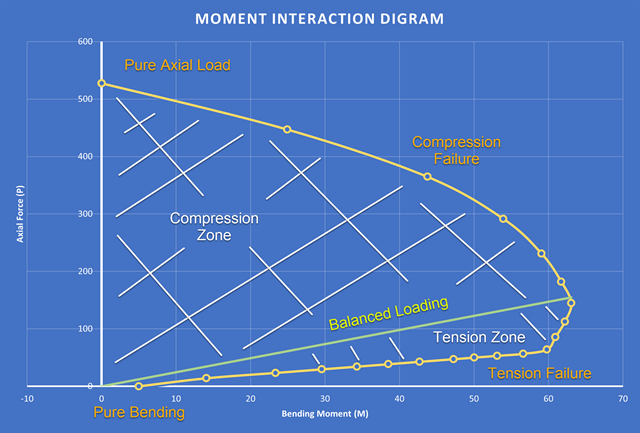
A new capability within RFEM 6 when designing concrete columns is being able to generate the moment interaction diagram according to the ACI 318-19 [1]. When designing reinforced concrete members, the moment interaction diagram is an essential tool. The moment interaction diagram represents the relationship between the bending moment and axial force at any given point along a reinforced member. Valuable information is shown visually like strength and how the concrete behaves under different loading conditions.
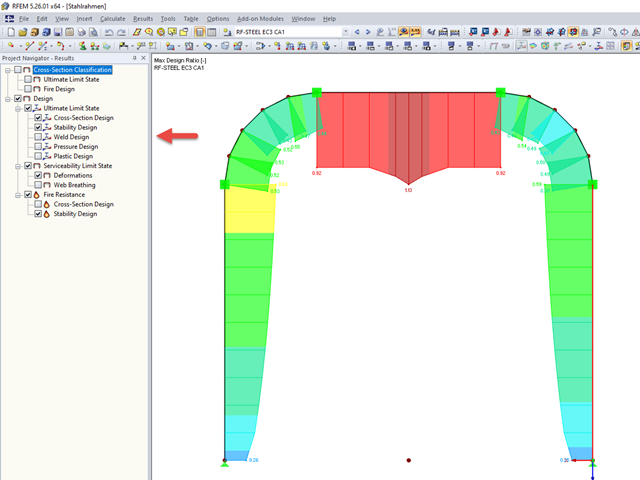
The add-on modules for designing structural member components according to national, European, and international standards also show design results in addition to numerical output in tables graphically, as diagrams displayed on the framework.
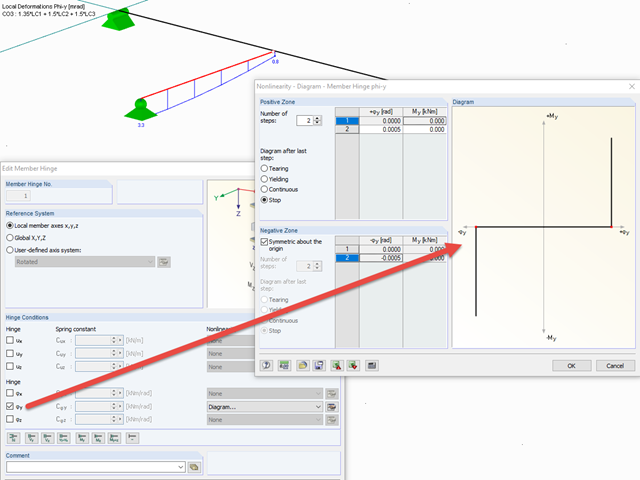
To simulate a support clearance in a connection between members, you can use the "Diagram" function for member hinges. To use this function, first define the relevant degree of freedom as release. Then, you can select the "Diagram" function from the drop‑down list.
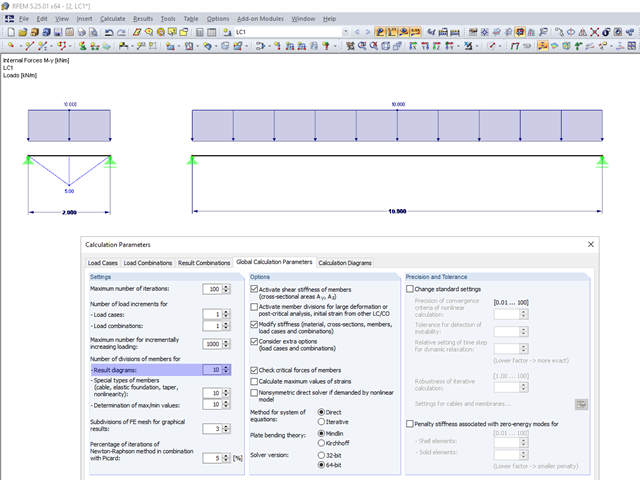
In the calculation parameters, you can set the number of member divisions for result diagrams. The effect of this setting option is shown in the following images.
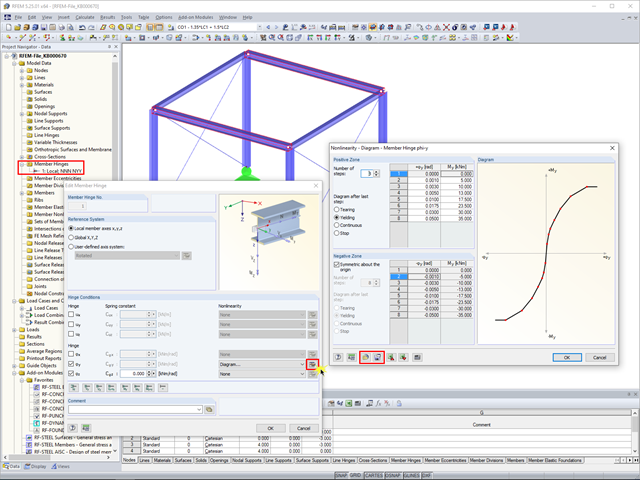
In RFEM 5 and RSTAB 8, it is possible to assign nonlinearities to member hinges. In addition to the nonlinearities "Fixed if" and "Partial activity", you can select "Diagram". If you select the "Diagram" option, you have to specify the according settings for the activity of the member hinge. For the individual definition points, it is necessary to specify the abscissa and ordinate values (deformations or rotations and the according internal forces) that define the hinge.
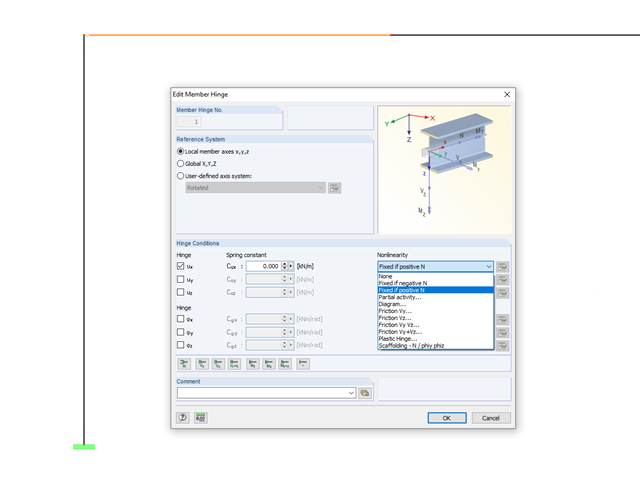
In RFEM and RSTAB, it is possible to define nonlinear properties of member releases. In addition to the activity diagrams and force-deformation relationship, you also have the simple option of using signs or limit values of the internal forces as criteria for the effectiveness of the release. This way, you can specify which internal forces should be transferred at the member end.
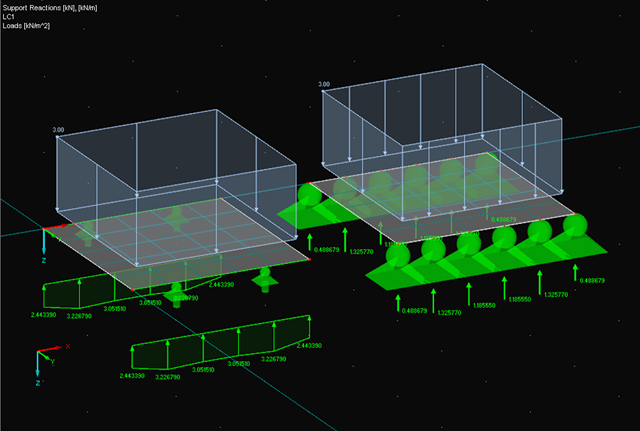
When evaluating line support forces, implausible diagrams sometimes arise at first glance. In particular, for variable loads at locations that also have a nodal support, at division points and edge locations of supported lines, the results sometimes show unexpected support reactions. Using the function of the linear smooth distribution in Project Navigator – Display does not always lead to the expected result diagram.
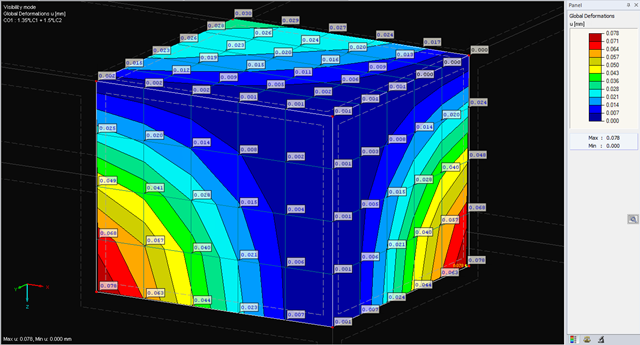
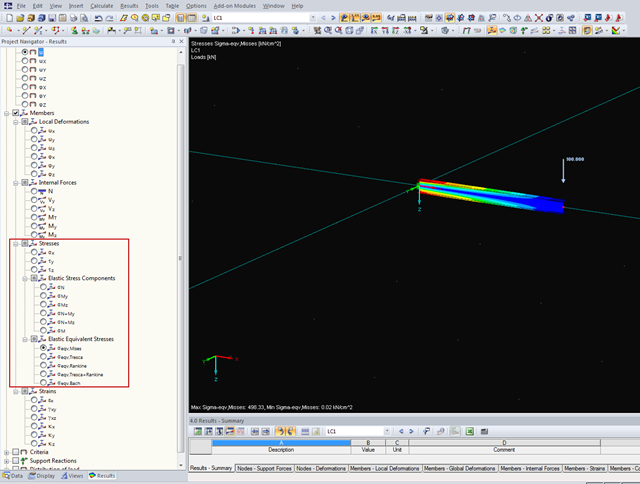
The deformations of the FE nodes are always the first result of an FE calculation. It is possible to calculate strains, internal forces, and stresses based on these deformations and the stiffness of the elements.
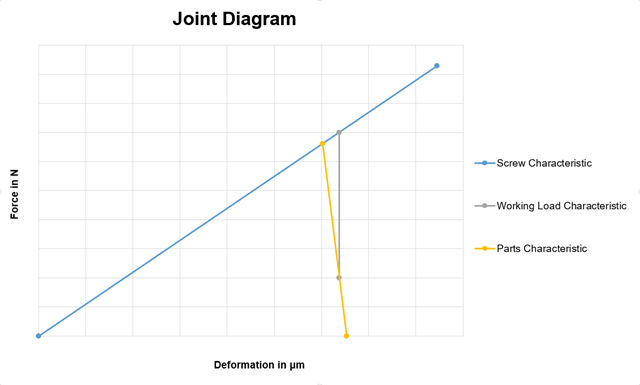
When modeling surface models, such as a frame joint or similar structures, there is always the question of how to model a prestressed bolt connection. In this case, it is always necessary to find a compromise between the practicable and detailed solution. The following article describes the modeling procedure of such a connection, based on the joint diagram calculation method.
![Section Factor Am/V for Unprotected Steel Components (Source: [5])](/en/webimage/009429/2418748/01-en-1-png.png?mw=640&hash=0fa099ecd1abc5310bef76fe3f22b7fe0c925df6)
Using RF-/STEEL EC3, you can apply nominal temperature-time curves in RFEM or RSTAB. For this, the standard time-temperature curve (ETK), the external fire curve, and the hydrocarbon fire curve are implemented in the program. Based on these diagrams, the add-on module can calculate the temperature in the steel cross-section and thus perform the fire design. This article explains the behavior of protected and unprotected steel cross‑sections.
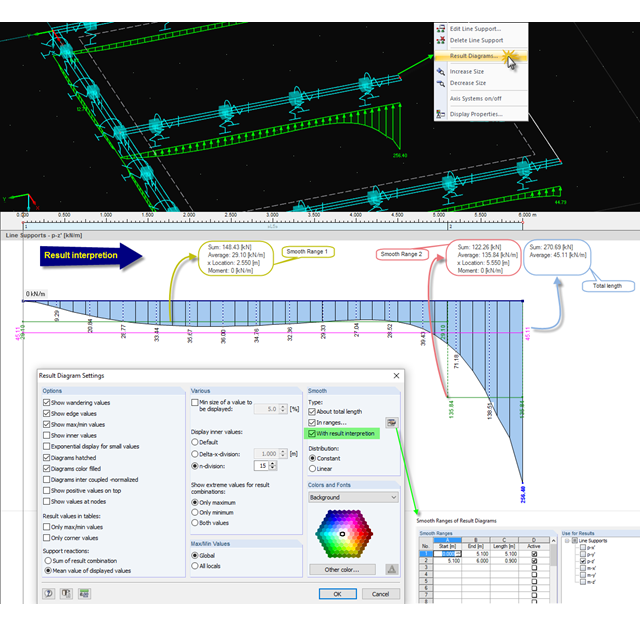
When evaluating results in the smooth state, you can display the average and sum values. This option is also available for parts of a line, a section, and so on. By importing the graphic into the printout report, you can document these values in the structural analysis.
To obtain forces for designing surface connections, you can look at the results using the "Result diagram" function of a connection line. Among other things, there are auxiliary tools such as "Average line" and "Average region".
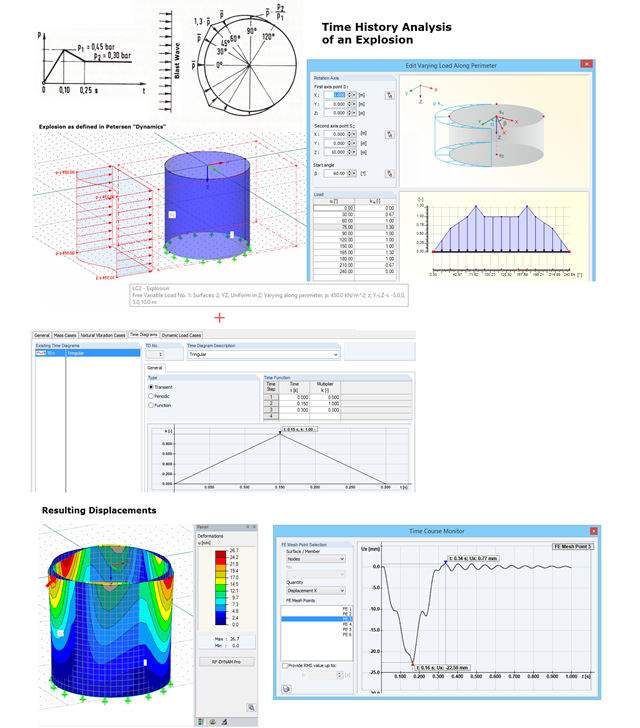
With RF-DYNAM Pro – Forced Vibrations, you can perform a time history analysis. For example, you can analyze an explosion acting on a nearby building structure. In "Dynamik der Baukonstruktionen" by Christian Petersen, formulas for time diagrams and load distribution are described to specify an explosion. The image shows the input of such an explosion load. Free variable loads are available in RFEM that enable flexible load distributions.
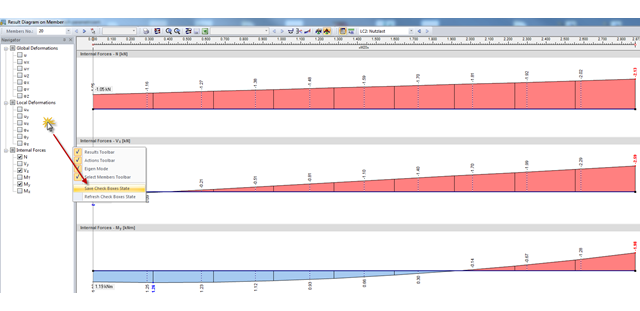
In RFEM and RSTAB, the check boxes for deformation in result diagrams are selected by default. To avoid creating a new user-defined result display every time, you can save the selection of check boxes displayed on the left.
In RFEM, you can save the results of individual load increments during the calculation and display them graphically. Thus, you can graphically display and check the reaction diagram of different load levels for nonlinear supports.
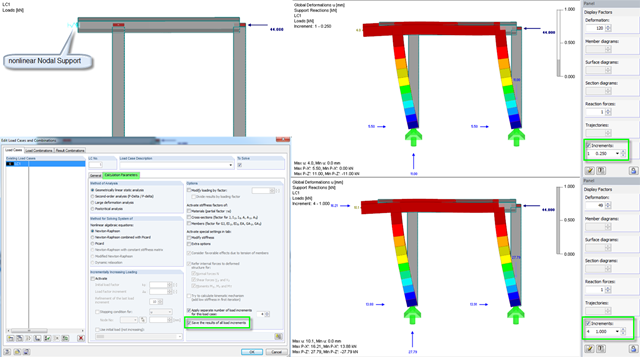
In RFEM, you can save the results of individual load increments during the calculation and display them graphically. Thus, you can graphically display and check the reaction diagram of different load levels for nonlinear supports.
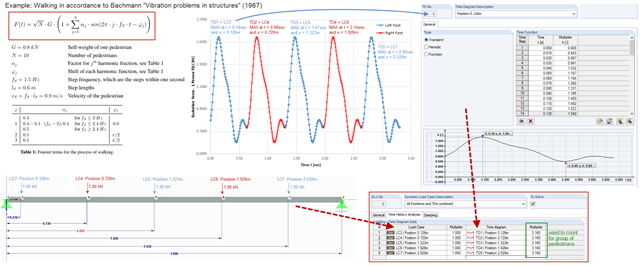
To simulate an excitation that varies over time and changes its position, you can combine several loading time diagrams in RF‑/DYNAM Pro - Forced Vibrations.
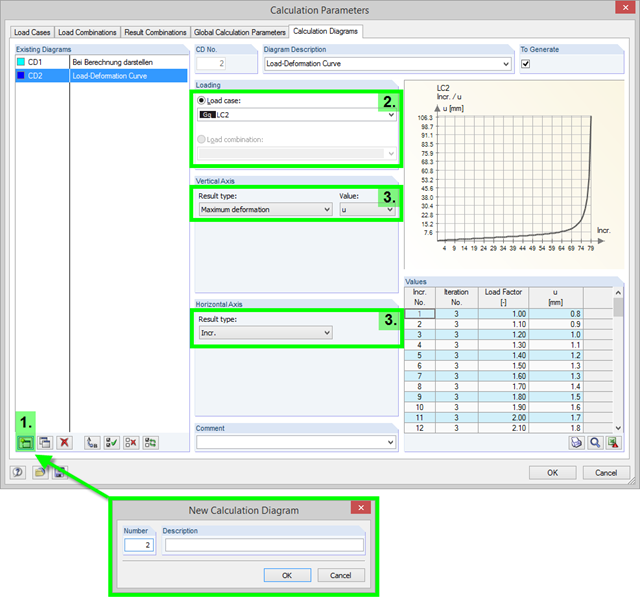
To record and display a relation between the various calculation results, you can use the calculation diagrams. You can create and display them using the "Calculation Parameters" dialog box available under "Calculation" → "Calculation Parameters".
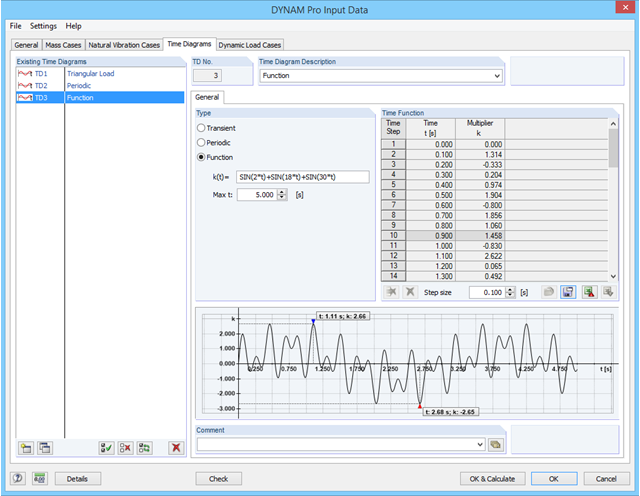
In RF-/DYNAM Pro - Forced Vibrations, you can define time diagrams directly as functions in an edit field. The parameter t is reserved for the time steps, but apart from that, all parameters as defined in the "Edit Parameter" dialog can be used in RF‑/DYNAM Pro.
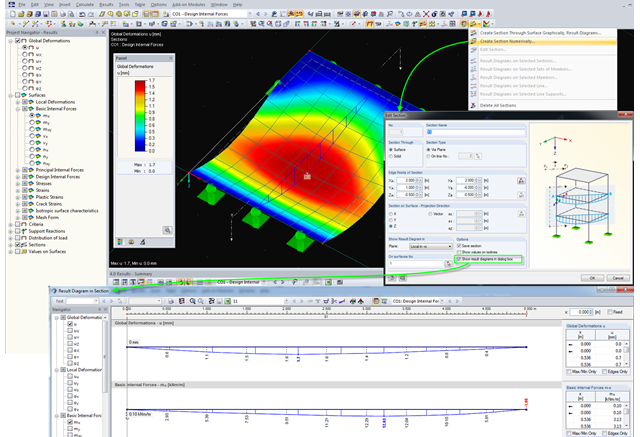
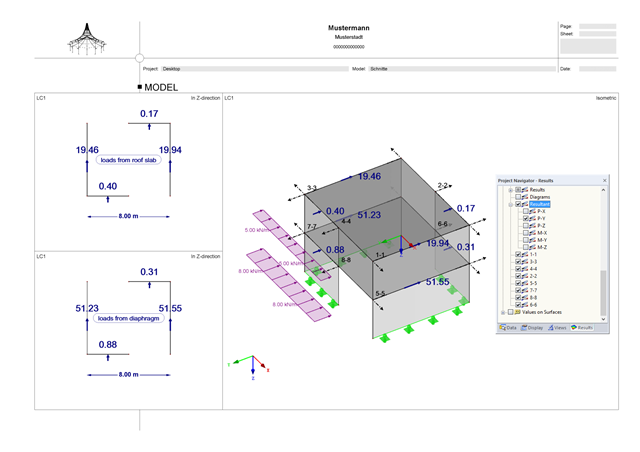
For evaluating results on surfaces, RFEM provides the option to define sections. Basically, two different types of sections are available. One, the creation of a temporary section showing the result diagrams of the desired cutting edge only once; the other, the definition of a section in the dialog box, which is then created as a separate object in RFEM, and thus the results can be viewed at any time. Displaying the results of defined sections is done graphically in RFEM, but they can also be displayed separately in a dialog box and be included in the printout report.
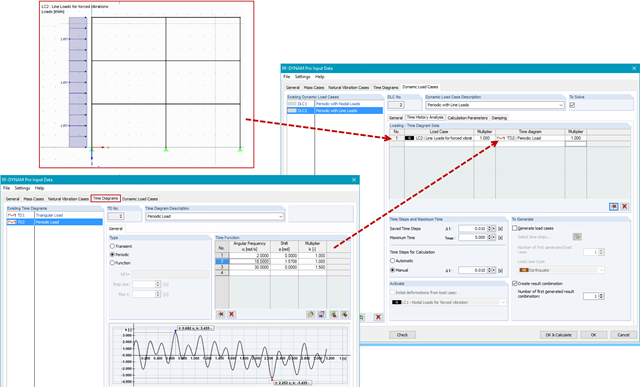
In RF-/DYNAM Pro - Forced Vibrations, you combine static load cases with time diagrams to define the type of excitation of your structure. This way, you can use not only nodal loads, but also use line, surface, free, or generated loads in the time history analysis.