


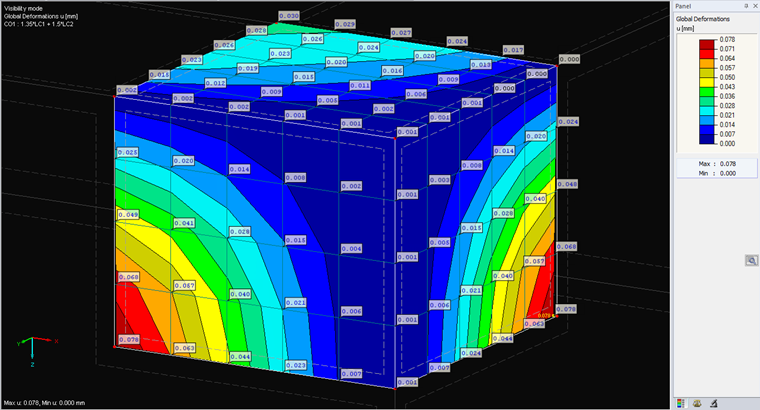
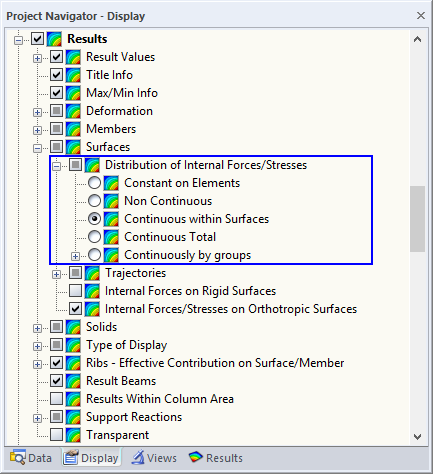
RFEM provides triangular or quadrangular FE elements for surfaces, which means that there are three or four deformations per FE element that can be recalculated with the stiffness of the FE element (for example, in stresses). Since several FE elements usually have the same FE node, there are as many results on one FE node as the number of elements present. The question now is, how are these results evaluated? In Project Navigator - Display, you can find five different options for displaying the distribution of internal forces within the surface.
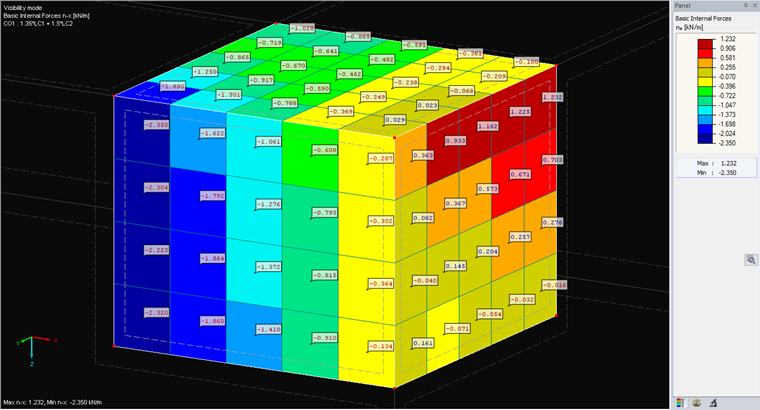
Constant on Elements
This option averages all nodal values of an FE element, and the entire FE element always has the same value (smoothed). Therefore, there is no distribution in the FE element as with the other options. This method is used in the program for the "Isotropic Nonlinear Elastic 2D/3D" material because the limit stress is determined in this way.
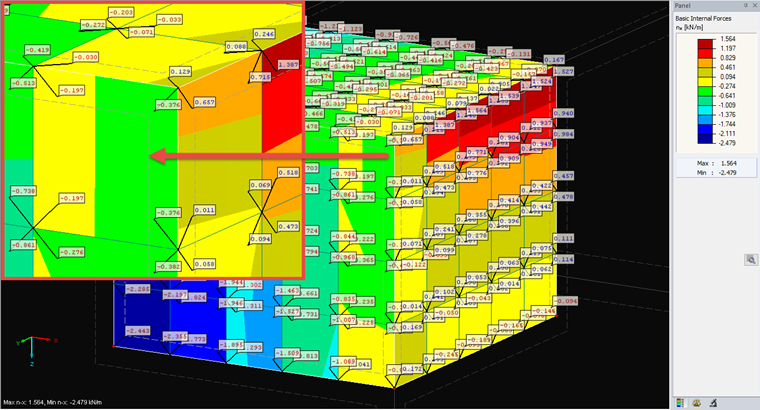
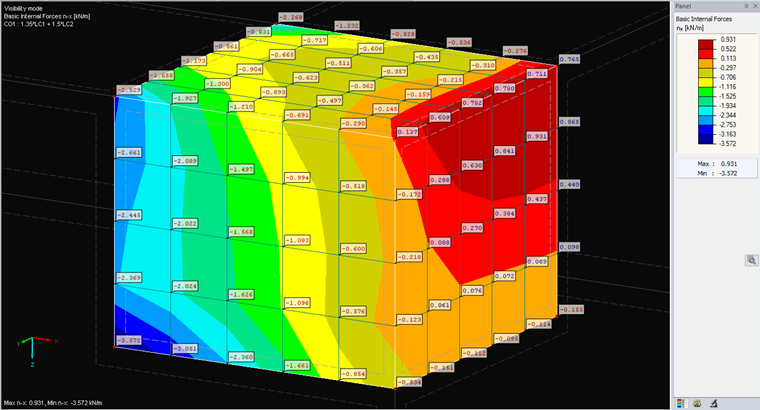
Non-Continuous
This option displays the raw data. As in the following options, a hyperbolic paraboloid is used for the distribution within the element. However, the FE nodal values are not averaged with adjacent elements. For this reason, the result often looks discontinuous/graduated. In fact, significant differences between FE elements indicate that a finer mesh is necessary for more accurate results.
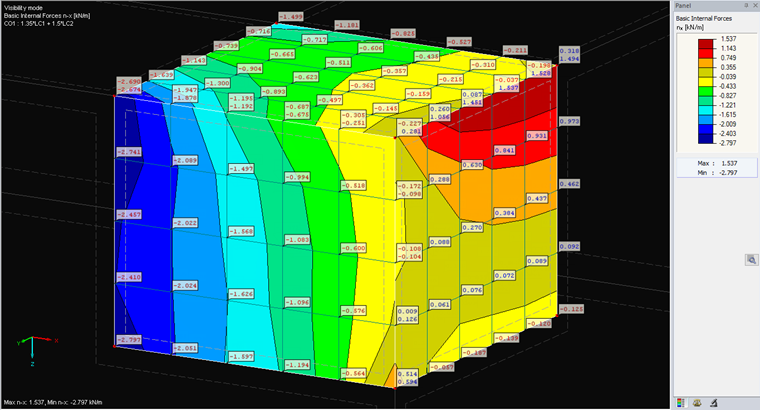
Continuous Within Surfaces
This option is the default setting. The values of all FE elements adjacent to an FE node are averaged. You can easily see or calculate this averaging in one point when comparing it to the "Non-Continuous" type. This type of smoothing can correspond to a distribution with a finer mesh; therefore, it is often used for the evaluation. However, since this is a smooth display, we recommending carrying out an analysis with "Non-Continuous" in critical areas.
Continuous Total
This option extends "Continuous Within Surfaces" by averaging at the edge of the surface to the next surface as well. This results in continuous distribution in the entire model, not only within one surface. Of course, it is also important to perform another analysis with the "Non-Continuous" type in critical areas.
Continuously by Groups
With the last option, you can decide whether to have continuous distribution between some surfaces or not. You can define groups where the distribution is "Continuous Total" and all the remaining surfaces are then automatically set to "Continuous Within Surfaces".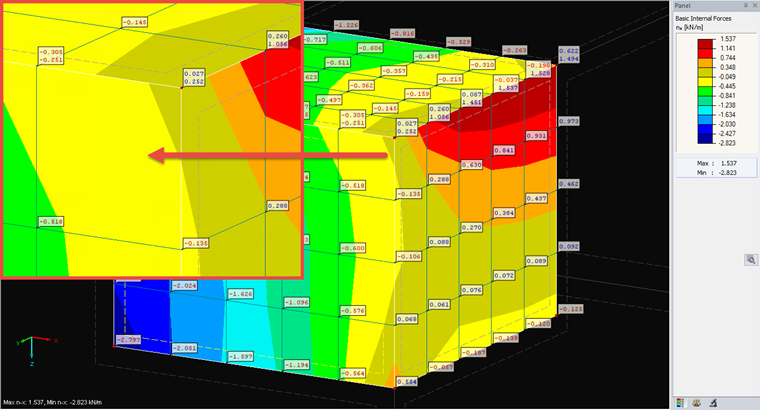
Summary
When selecting the distribution of internal forces/stresses on surfaces, you have to specify that the result closest to the calculation is displayed as "Non-Continuous". This distribution also strongly demonstrates the discretization due to the FEM calculation. In reality, such distribution is unlikely to occur; therefore, the "Continuous Within Surfaces" smoothing is preset. This creates a continuous distribution within surfaces by means of smoothing. Since this distribution is closer to a real result, but does not correspond to the actual results, we recommend always analyzing critical areas such as singularities (for example, point-like load introduction or connecting point of several surfaces).