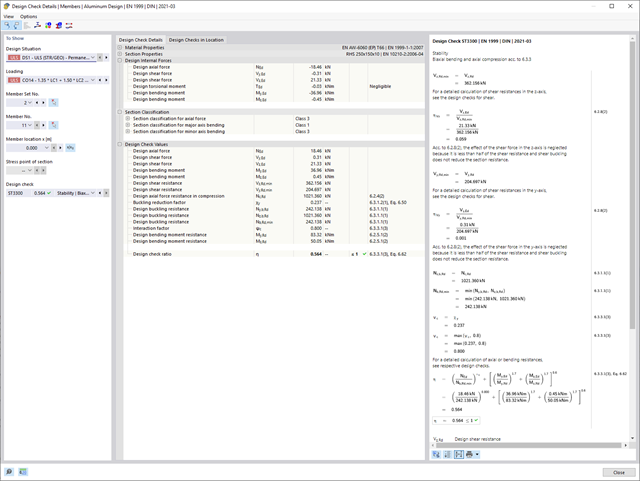
Do you prefer it clear? So do we! That's why all performed design checks for the design standard are displayed for you in a clear way. You determine a design criterion for each design check. You get design details, which include the initial values, intermediate results, and final results, arranged in a structured way for each design check. You can find the calculation process with the applied formulas, standard sources, and results in great detail in an information window in the design details.
Dlubal Software just makes everything a little easier. The performed design checks of the design standard are displayed in a clear way. A design criterion is determined for each design check. Furthermore, the program deliver the design details displayed in a structured way, including the initial values, the intermediate results, and the final results. An information window in the design details shows you the calculation process with the applied formulas, standard sources, and results in great detail.
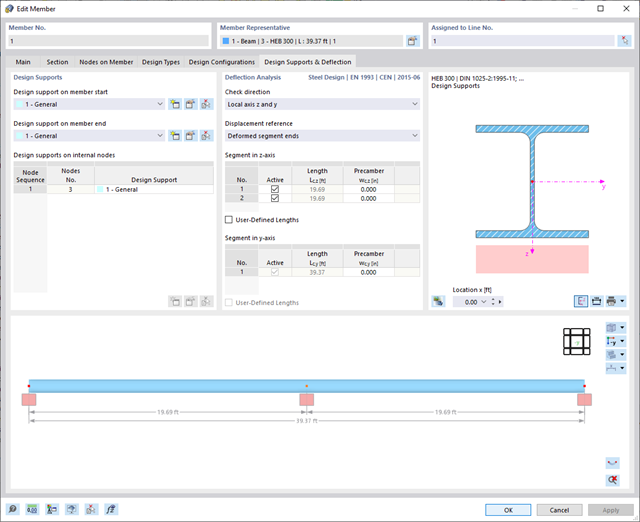
In RFEM/RSTAB, you have the option to generate and then calculate the load or result combinations required for the serviceability limit state. You can select these design situations for the deflection analysis in the Steel Design add-on. The calculated deformation values are determined accordingly at each location of a member, depending on the specified precamber and reference system. Finaly, you can compare these deformation values with the limit values.
Did you know? You can specify the deformation limit value individually for each structural component in Serviceability Configuration. Define the maximum deformation depending on the reference length as the allowable limit value. By defining design supports, you can segment the components in order to determine the corresponding reference length automatically for each design direction.
Based on the position of the assigned design supports, the distinction between beams and cantilevers is made automatically so the limit value can be determined accordingly.
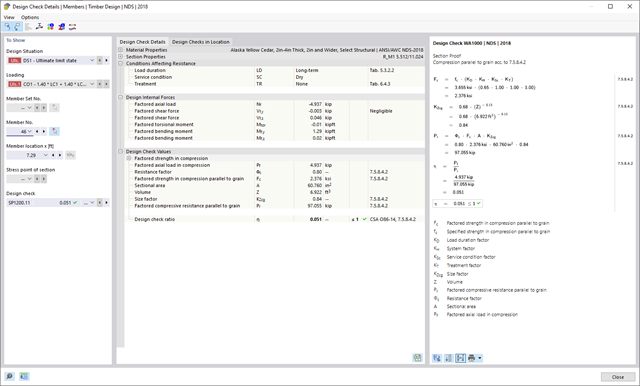
Is a clear arrangement important for you? The program provides you with a clear overview of all performed design checks for the design standard. For each design check, it is necessary to determine a design criterion. There are also design details arranged in a structured way, including the initial values, intermediate results, and final results. You can laso find here an information window where the calculation process with the applied formulas, standard sources, and results is displayed in great detail.
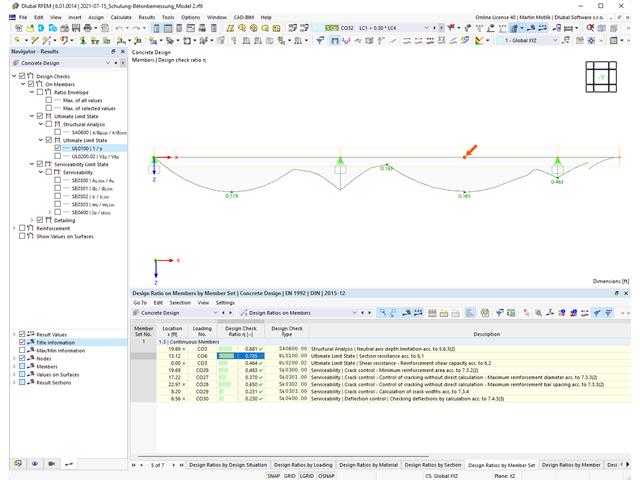
The structural analysis program provides you with a clear overview of all performed design checks for the design standard. You have to determine a design criterion for each design check. In addition to the ultimate limit state and the serviceability limit state design, the program checks the design rules of the standard. For each design check, there are the design details including the initial values, intermediate results, and final results, arranged in a structured way. An information window in the design details shows you the calculation process with the applied formulas, standard sources, and results in great detail.
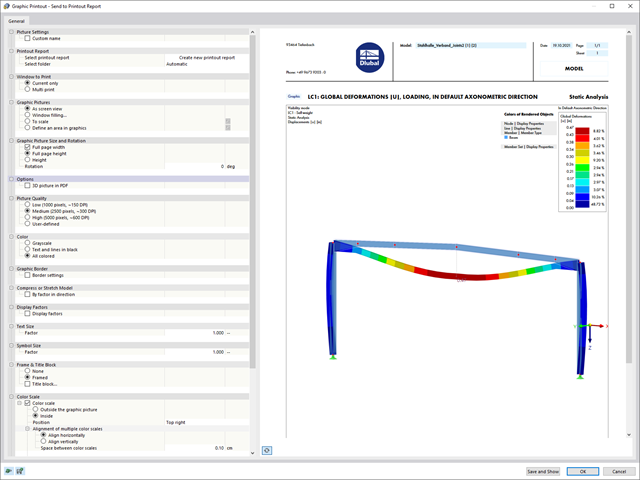
Various new options make it easier for you to print graphics in the future. Your new graphic printout dialog now includes:
- Library-controlled mass print function for all program graphics
- User-defined print area selection
- 3D function for later 3D functionalities in the final PDF
- Automatic separation of images for scale prints and the function for displaying an overview image
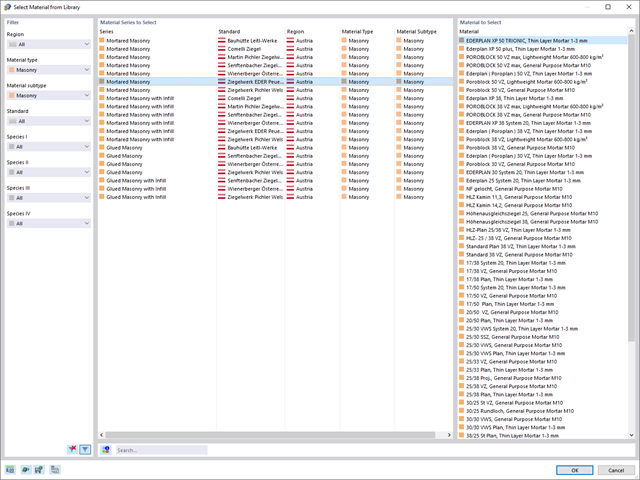
You enter and model the structure directly in RFEM. You can combine the masonry material model with all common RFEM add-ons. This enables you to design the entire building models in connection with masonry.
The program automatically determines for you all parameters required for the calculation by using the material data that you have entered. Then, it finally generates the stress-strain curves for each FE element.

After you have completed the design, the program takes care of clearly arranged results. Thus, the program shows you the resulting maximum stresses and stress ratios sorted by section, member/surface, solid, member set, x-location, and so on. In addition to the tabular result values, the add-on shows you the corresponding cross-section graphic with stress points, stress diagram, and values as well. You can relate the design ratio to any kind of stress type. The current location is highlighted in the RFEM/RSTAB model.
In addition to the tabular evaluation, the program offers you even more. You can also graphically check the stresses and design ratios on the RFEM/RSTAB model. It is possible for you to adjust the colors and values individually.
The display of result diagrams of a member or set of members enables you a targeted evaluation. For each design location, you can open the respective dialog box to check the design-relevant section properties and stress components of any stress point. Finally, you have the option of printing the corresponding graphic, including all design details.
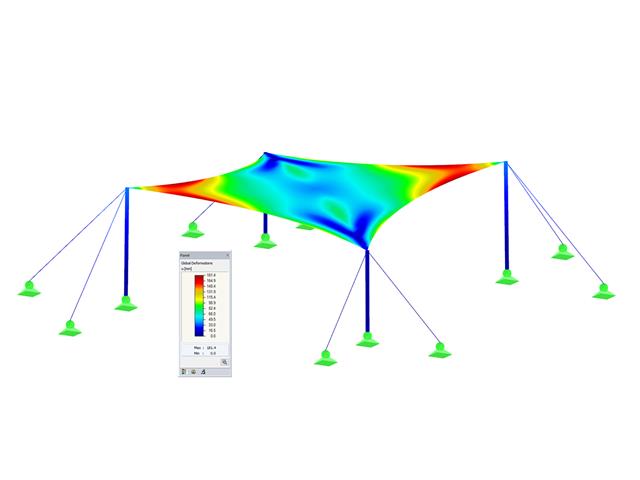
- Planar and geodesic cutting lines
- Flattening of double-curved surface parts of tensioned membranes or pneumatic cushions
- Definition of cutting patterns by using boundary lines which are not required to be connected
- Sophisticated flattening based on the minimum energy theory
- Welding and boundary allowances
- Uniform or linear compensation in warp and weft direction
- Possibility of different compensations for boundary lines
- Adaptable data organisation (any additional modification of input data is considered up to the final "weld")
- Graphical display of cutting patterns
- Statistical information about each cutting pattern (width, length, size)
- Option to automatically generate cutting patterns from cells
When performing the design of tension, compression, bending, and shear loading, the module compares the design values of the maximum load capacity to the design values of the actions.
If the components are subjected to both bending and compression, the program performs an interaction. In RF-/STEEL EC3, you can determine the factors according to Method 1 (Annex A) or Method 2 (Annex B).
The flexural buckling design requires neither the slenderness nor the elastic critical buckling load of the governing buckling case. The module automatically calculates all required factors for the bending stress design value. RF-/STEEL EC3 determines the elastic critical moment for lateral-torsional buckling for each member on every x-location of the cross-section. If required, you only need to specify lateral intermediate supports of the individual members/sets of members, definable in one of the input windows.
If members are selected for the fire resistance design in RF-/STEEL EC3, there is another input window available where you can enter additional parameters, such as: a coating or cladding type. Global settings cover the required time of fire resistance, temperature curve, and other coefficients. The printout report lists all intermediate results and the final result of the fire resistance design. Furthermore, it is possible to print the temperature curve in the report.
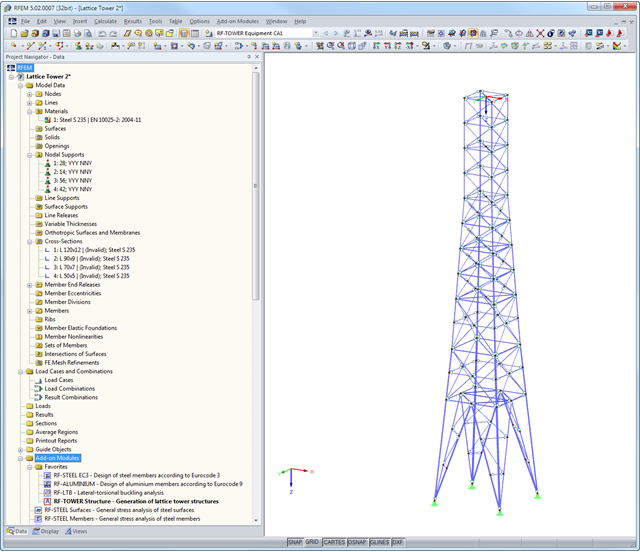
Finally, it is possible to export the generated model to RFEM/RSTAB with a single mouse click.
The complete module data are part of the RFEM/RSTAB printout report. The report contents and the extent of the results can be selected specifically for the individual designs.
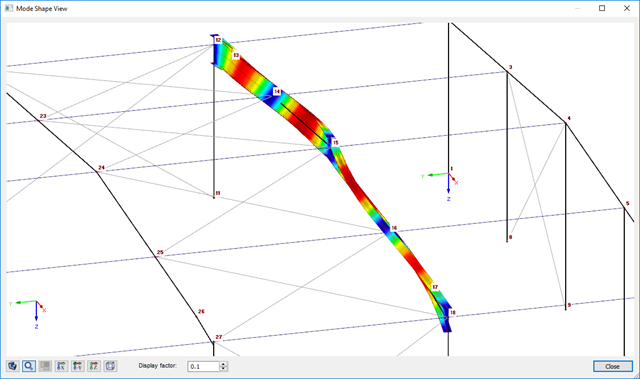
After the calculation, the deformations, internal forces, support forces, and stresses are displayed. Since the module considers warping torsion, the diagrams of the warping bimoment, as well as of the primary and the secondary torsional moment, are also available. Stability analysis uses the imperfections during the calculation and determines the critical load factors that can be used to determine Mki and Nki.
In addition to the result values in tables, the corresponding cross-section graphic is shown. In RFEM/RSTAB, various results are highlighted in different colors on the member model. You can modify the colors and values assigned.
Result diagrams of a set of members provide targeted evaluation. It is also possible to represent all intermediate values. Finally, it is possible to export all tables to MS Excel or in a CSV file. A dialog box includes the necessary export data.
The results are displayed with references to EN 1993-1-5 or DIN 18800. In addition, RF-/PLATE-BUCKLING shows calculation results separately for the action of only one edge load as well as for the simultaneous effect of all edge loads.
In the case of several load cases, the governing load case is displayed separately. Thus, time-consuming comparison of calculation data is not necessary.
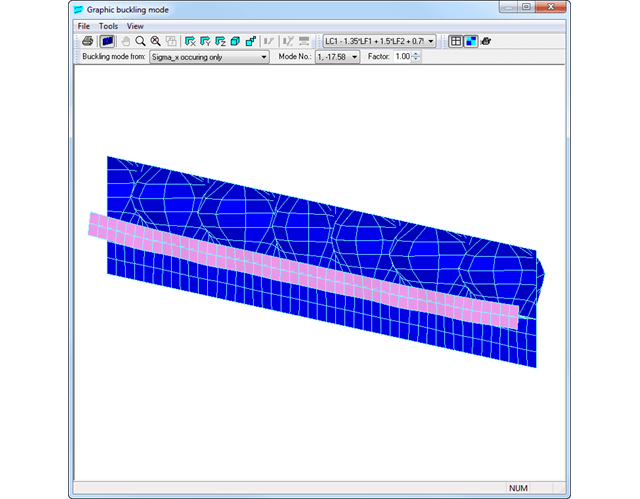
Window 2.5 lists the critical buckling load factors of all load cases and the respective buckling modes.
You can visualize the buckling modes and loads of the buckling panel in the graphic window. This facilitates a quick overview of the buckling modes and loads. Using the animation option, you can clearly represent the buckling behavior of stiffened plates.
Finally, it is possible to export all tables to MS Excel or in a CSV file.
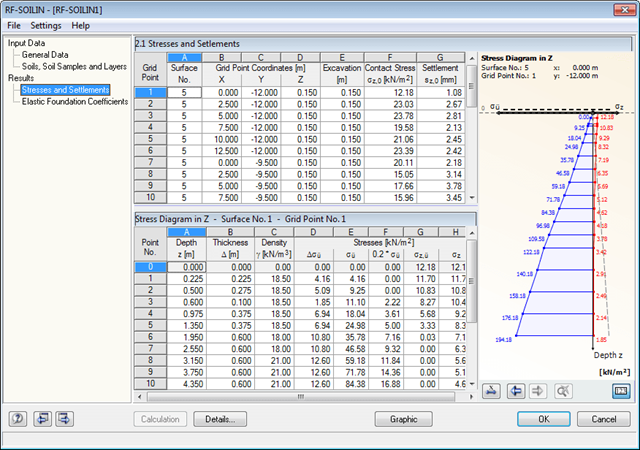
The calculated stresses and settlements are displayed in result windows. In addition, it is possible to evaluate the results graphically. The graphic displays the position and the layer arrangement of the soil samples to clarify the results.
The final result window shows the elastic foundation coefficients. Graphical evaluation is possible as well.