


Opis prac
W niniejszym przykładzie sprawdzającym, współczynnik ciśnienia wiatru (Cp) płaskiego dachu i ścian badamy przy użyciu minimalnych obciążeń obliczeniowych ASCE 7-22 i związanych z nimi kryteriów dla budynków i innych konstrukcji [1]. W rozdziale 28.3 (Obciążenia wiatrem - główny układ odpornościowy na siłę wiatru) i Rysunek 28.3-1 (przypadek obciążenia 1) znajduje się tabela przedstawiająca wartość Cp dla różnych kątów nachylenia dachu. W bieżącym przykładzie wybraliśmy θ=0 jako dach płaski.
Chociaż symulacje obliczeniowej dynamiki płynów (CFD) są coraz częściej wykorzystywane w zastosowaniach inżynierii wiatrowej, norma ASCE 49 nie opisuje jasno wszystkich podstawowych technik CFD. Każde wykorzystanie CFD do określenia obliczeniowego układu nośności na główną siłę wiatrem (MWFRS), obciążenia wiatrem konstrukcji ' lub innych obciążeń wiatrem wymaga sprawdzenia oraz badania weryfikacyjnego i walidacyjnego (V&V) [2] . Wynika to z faktu, że podobna norma jest nadal potrzebna do udokumentowania procedur wymaganych do uzyskania wiarygodnych i dokładnych obciążeń wiatrem za pomocą narzędzi CFD. W międzyczasie norma ta zostanie opracowana. Aby zapewnić jakość i kontrolę jakości tej procedury w przypadku braku normy, wymagane jest [1].
Kluczowym czynnikiem w symulacji CFD jest znalezienie najbardziej kompatybilnych konfiguracji ze standardami dotyczącymi danych wejściowych, takich jak modele turbulencji, profile prędkości wiatru, intensywności turbulencji, warunki warstwy granicznej, kolejność dyskretyzacji i inne. Ważne jest, aby normy nie zawierały informacji wymaganych do symulacji numerycznej, takiej jak symulacja CFD. W obecnej wersji VE najbardziej kompatybilne ustawienia RWIND przedstawiliśmy na przykładzie dachu i ścian ASCE 7-22.
Rozwiązanie analityczne i wyniki
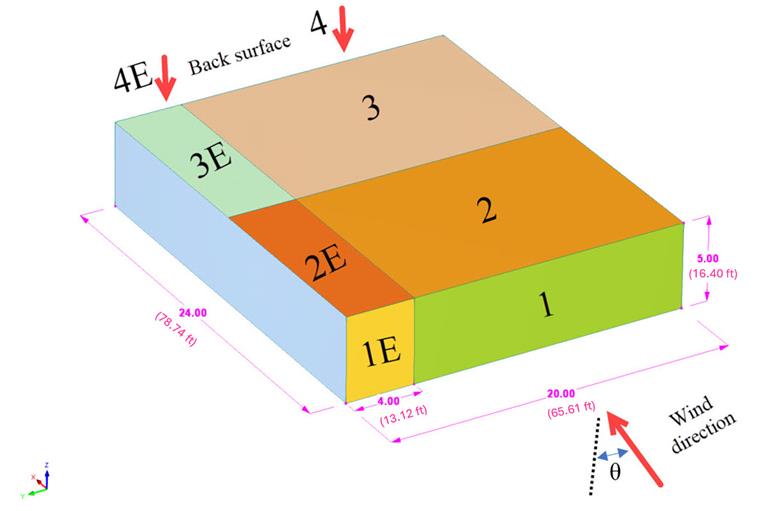
Zamknięty model trójwymiarowy (jednostka: m (ft)) przyjmuje się zgodnie z rys. 1, na którym pokazano 8 stref wiatrowych (1,2,3,4,1E,2E,3E,4E). Współczynnik ciśnienia zewnętrznego (GCpf ) dla zamkniętych, częściowo zamkniętych i częściowo otwartych budynków o niskich ścianach i dachach pokazano na Rysunku 28.3-1 w ASCE 7-22. Ważne założenia i dane wejściowe pokazano również w tabeli 1.
| Tabela 1: Stosunek wymiarów i dane wejściowe | |||
| Bazowa prędkość wiatru | V | 30 (67.10) | m/s (mph) |
| Kategoria terenu | 2 | - | - |
| Średnia wysokość dachu | h | 5 (16.40) | m (ft) |
| Wymiar poziomy (odległość od krawędzi) | α | 4 (13.12) | m (ft) |
| Kąt nachylenia dachu | θdach | 0 | Stopień |
| Gęstość powietrza - RWIND | ρ | 1,25 (0,078) | kg/m3 (funt/stopę3 ) |
| kierunki wiatru | θwiatr | 0, 22.5, 45 | Stopień |
| Model turbulencji - RWIND | Stacjonarne RANS k-ω SST | - | - |
| Lepkość kinematyczna (równanie 7.15, EN 1991-1-4) - RWIND | ν | 1,5*10-5 (1,6*10-4 ) | m2/s (ft2/s) |
| Kolejność schematów - RWIND | Drugi | - | - |
| Pozostała wartość docelowa - RWIND | 10-4 | - | - |
| Typ pozostałości - RWIND | Ciśnienie | - | - |
| Minimalna liczba iteracji - RWIND | 800 | - | - |
| Warstwa graniczna - RWIND | NL | 10 | - |
| Typ funkcji ściany - RWIND | Rozszerzone/mieszane | - | - |
| Intensywność turbulencji (najlepsze dopasowanie) - RWIND | I | Teren 2 | - |
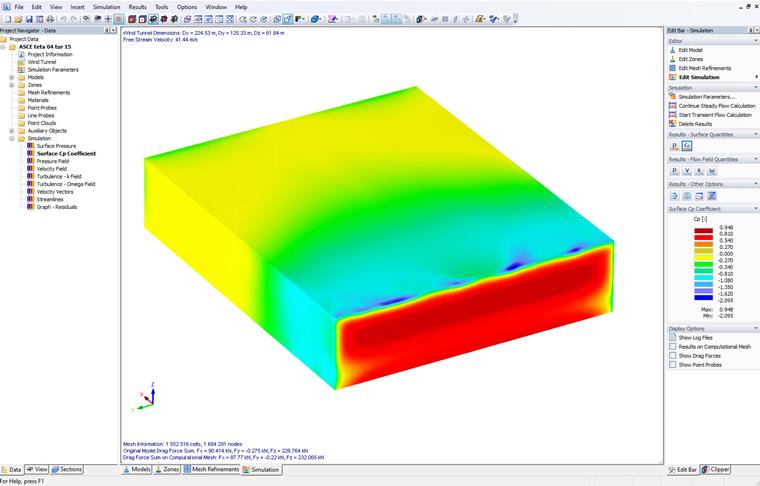
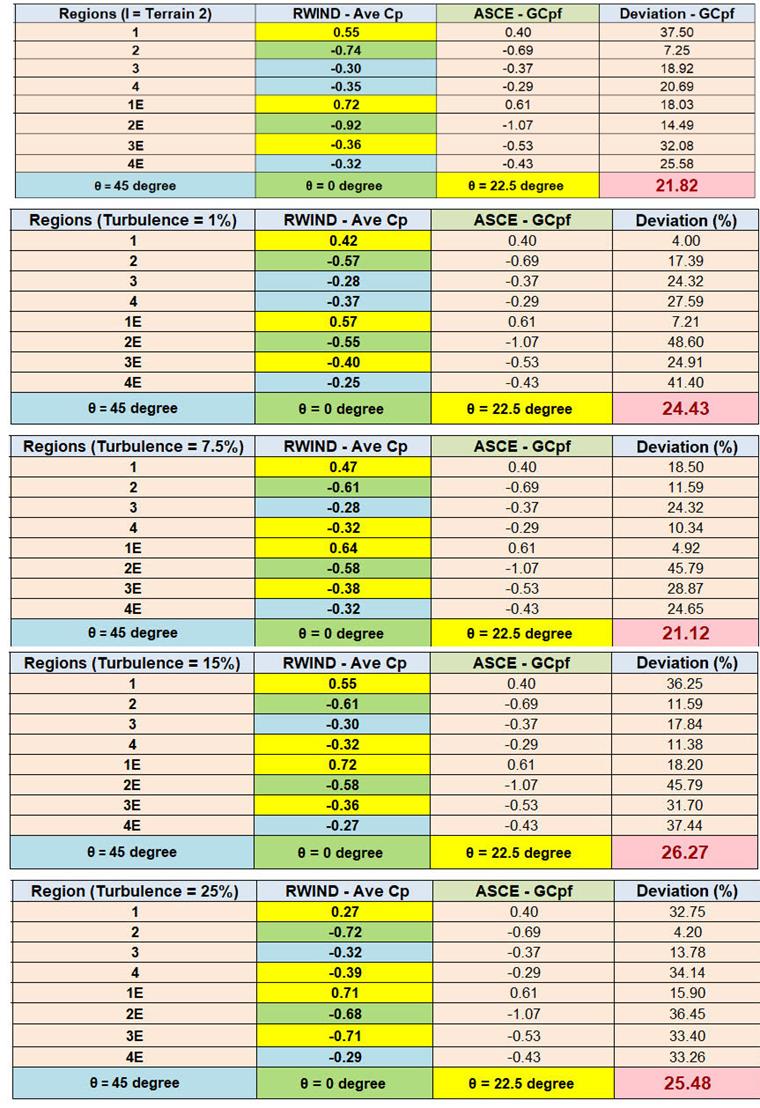
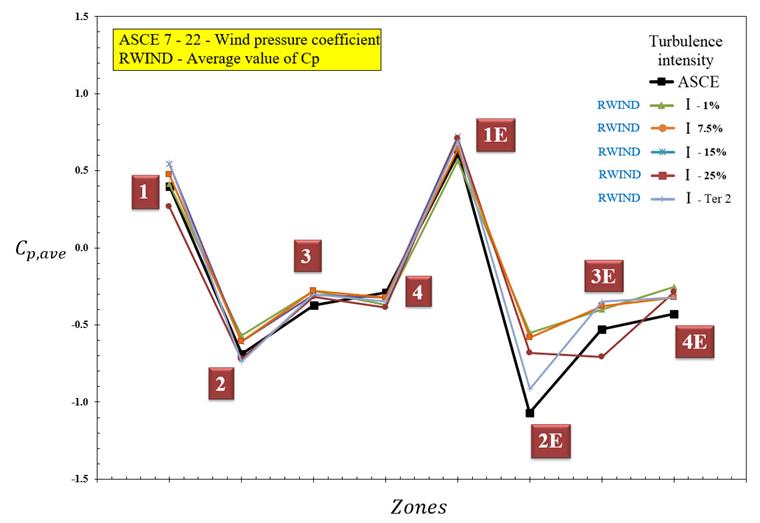
Średni współczynnik ciśnienia wiatru Cp oblicza się dla różnych stref o różnej intensywności turbulencji. W celu znalezienia krytycznej wartości Cp uwzględniane są trzy kierunki wiatru (θ= 0, 22,5, 45 stopni). Kontur Cp pokazano na rysunku 2. Tabelę wartości odchylenia oraz wykres wartościCp dla różnych intensywności turbulencji pokazano na rysunku 3 i rysunku 4. Cztery stałe i jedna zmienna (w zależności od terenu 2) intensywności turbulencji są uwzględniane przy przeprowadzaniu symulacji wiatru. Wyniki wykazują dobrą zgodność, gdy profil turbulencji jest bliski kategorii Teren 2.
Uwagi końcowe
W omawianym przykładzie, przeanalizowaliśmy weryfikację uśrednionej wartości Cp dla dachów i ścian, która została przedstawiona w ASCE 7-22 przy użyciuRWIND. Wyniki pokazują, że zalecana konfiguracja RWIND jest zgodna z normą. Wyższa intensywność turbulencji zbliżona do wariantu profilu turbulencji w Terenie 2 daje dokładniejsze wyniki niż niski profil turbulencji. Ważne jest, aby uwzględnić krytyczny kierunek wiatru Scenariusz, aby uzyskać wartość ekstremalną ASCE 7-22. Wartości odchylenia (różnice około 20%) pochodzą głównie ze współczynników bezpieczeństwa i podejścia statystycznego stosowanego w normach.
Model dachu płaskiego z zalecanymi ustawieniami można również pobrać tutaj: