


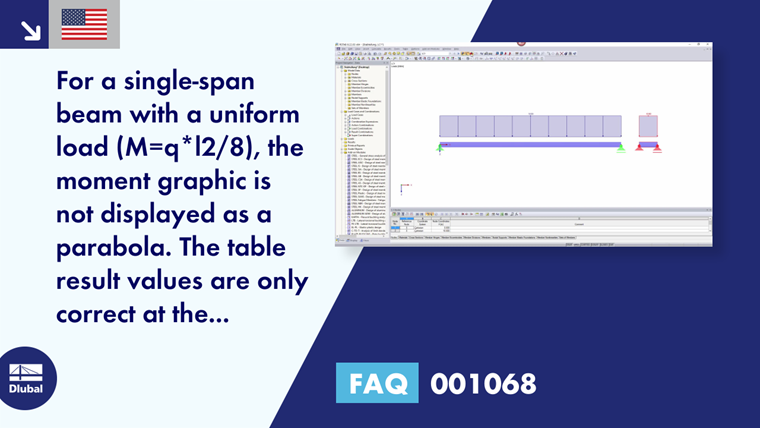
The problem with the graphic of internal forces is caused by the member divisions. Several divisions are to be considered in RSTAB.
1. Member Divisions for Result Tables
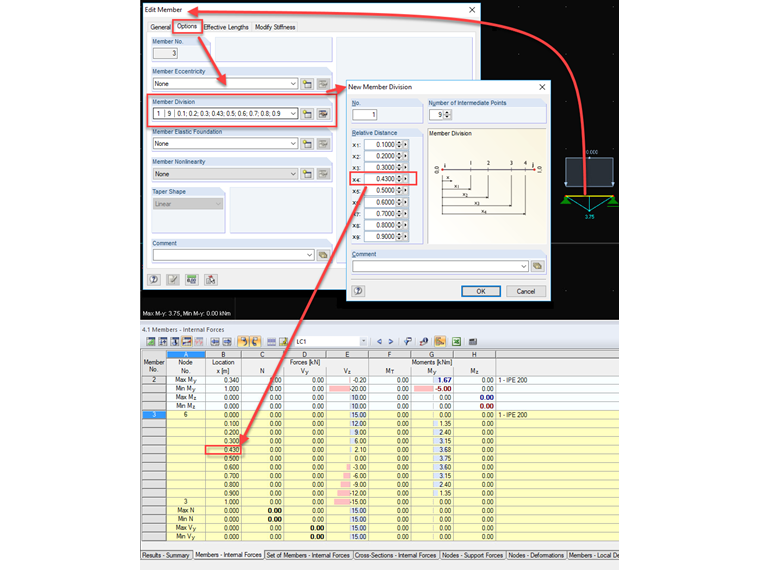
The member divisions for result values can be created via "Insert" → "Model Data" → "Member Divisions". This division ensures that the internal forces of members can also be displayed at intermediate points in RSTAB Table 4.1, for example. The graphical result display remains unchanged.
2. Member Divisions for Graphical Display
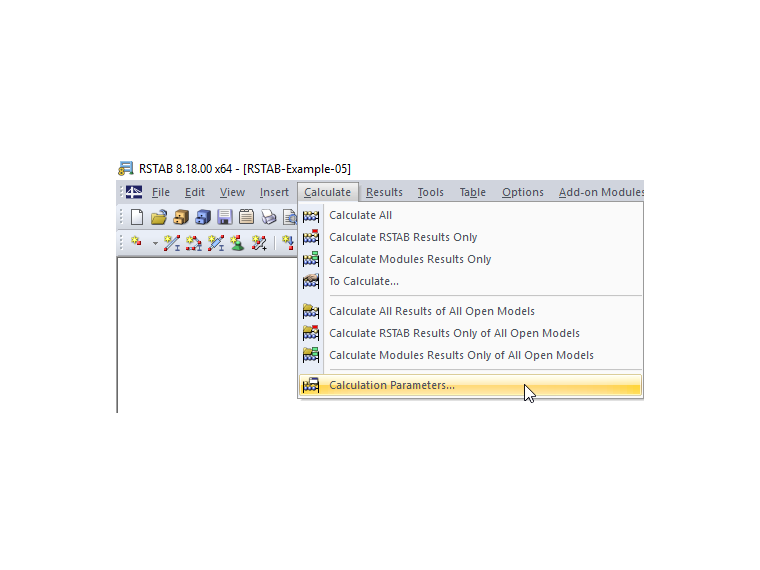
The divisions for the graphical result diagram and the determination of extreme values can be displayed and controlled in the calculation parameters (drop-down menu "Calculation").
If you set the value for "Result Diagrams" to a larger value, the graphic of the internal forces is also displayed in a more detailed way.
This division in the calculation parameters must be considered globally. It refers to the longest member. Therefore, shorter members do not have the same number of divisions, but similarly sized sections.
Therefore, to improve the graphic, we recommend applying a finer member division.