


For very large structures with many degrees of freedom or structures that have fundamental eigenvalues in the high-frequency range (piping systems, for example), these requirements may be difficult to meet. In such cases, ZPA (Zero Period Acceleration) is gaining in importance. This method is also able to consider masses in the supports themselves, which has a decisive influence on the support forces.
A distinction is made between three frequency ranges, which are used to categorize the system responses in different ways (see Image 01): (1) low-frequency range, (2) mid-frequency range, and (3) high-frequency range
![Spectral Acceleration Sa [m/s²] Versus Natural Frequency f [Hz] of Narrow-Band Response Spectrum According to EN 1998-1 [1]](/en/webimage/009251/2417757/01-en-png.png)
The low-frequency and mid-frequency ranges (f < fZPA) are the ranges usually considered in structural dynamics. Buildings have dominant natural frequencies in this area and in many cases, more than 90% of the structural mass is activated with these eigenvalues. The system responses in the low-frequency range are periodic and the results of various eigenvalues are phase-shifted. The superposition of the responses from individual eigenvalues is done quadratically, either with the SRSS or, better, with the CQC rule.
In the high-frequency range (f > fZPA), the system responses are pseudo-static; the responses from individual eigenvalues have the same phase. The modal superposition can thus be executed as an algebraic sum. Instead of dynamically considering these high frequencies, it is common practice to determine the missing activated masses and add the responses of the entire high-frequency range pseudo-static by means of the ZPA value. The ZPA value corresponds to the value from the response spectrum for the period T = 0 sec; ZPA = Sa(T=0). However, a user-defined value for the ZPA value is also conceivable. This method is referred to as the ZPA method, missing-mass method, or static correction [2, 3, 4].
Midrange frequencies (fSP < f < fZPA) provide system responses that are partly periodic and partly pseudo-static. These frequencies can be combined with special superposition rules such as the Gupta method [2] to account for the algebraic summation of pseudo-static contributions. However, superposition using standard quadratic rules such as the CQC rule is also common.
The frequency fSP (sp = spectral peak) corresponds to the maximum value of the spectral acceleration. The ZPA (ZPA = Zero-Period Acceleration) frequency fZPA is the minimum frequency with which the acceleration approximately reaches the ZPA value.
Calculation of ZPA Components
The components of the activated masses at each individual node in the structure can be determined as follows:
where
i = 1...p = number of eigenvalues considered in the response spectrum analysis
j = direction of earthquake excitation
mj = (mX,j, mY,j, mZ,j) = amount of the activated masses at each node in the excitation direction j
Γij = ratio factors for eigenvalue i and direction of excitation j
ui = (uX, uY, uZ)T = eigenform of the eigenvalue i at a single node, mass-normalized with Mi = uiT ∙ M ∙ ui = 1 kg
The fraction of missing, unactivated masses at each individual node is the difference from the total structural mass and is determined as follows:
mj,missing = 1 - mj
The equivalent loads at each node and following this, deformations and internal forces for the ratio of non-activated masses, are determined as follows:
Fj = mj,missing ∙ ZPAj ∙ M
where
Fj = (FX,j, FY,j, FZ,j) = equivalent loads at each node for the ratio of non-activated masses resulting from the excitation direction j
ZPAj = spectral acceleration Sa,j(T=0) in the direction of the excitation j
M = (MX, MY, MZ) = mass at the individual nodes in the structure
The results of the ZPA components thus determined are considered as another eigenvalue in the modal superposition. The superposition with the results of dynamically considered eigenvalues can be performed by means of the SRSS rule or as an absolute sum. The absolute sum provides conservative results.
Realization in DYNAM Pro – Forced Vibrations
In DYNAM Pro – Forced Vibrations, the ZPA analysis is applied when the "Apply Static Correction" check box is selected. The setting is shown in Image 02.

In DYNAM Pro, the determination of the non-activated masses and the resulting equivalent loads is carried out internally. The ZPA value is defined with the value from the response spectrum to the period T = 0 sec; ZPA = Sa(T=0). The results of the ZPA component are superimposed as an absolute sum with the results of dynamically considered eigenvalues.
Rt = |RSRSS/CQC| + |Rmissing|
where
Rt = results after modal and directional superposition, including the ZPA component
RSRSS/CQC = results of the dynamically considered eigenvalues modally superpositioned with the SRSS or CQC rule
Rmissing = results of the ZPA component
The results after superimposition are exported as a result combination to the main program, RSTAB.
Example
A cantilever with five degrees of freedom shows how the ZPA analysis is implemented in DYNAM Pro – Forced Vibrations. A very simple system is considered, to allow the traceability of the results. A rigid cross-section RO 508.0 x 10.0 with Iy = 48.520 cm4 made of S 235 steel is chosen in order to achieve frequencies above the value fZPA with relevant mass participation. The weight of the carrier of 612.3 kg is evenly distributed over the six nodes (including support nodes). In addition, a mass of 1 t is defined at Node 5. The masses and the excitation of the system act in the X-direction. The structure with mass distribution, resulting natural frequencies, and effective modal masses is shown together with the user-defined response spectrum in Image 03.
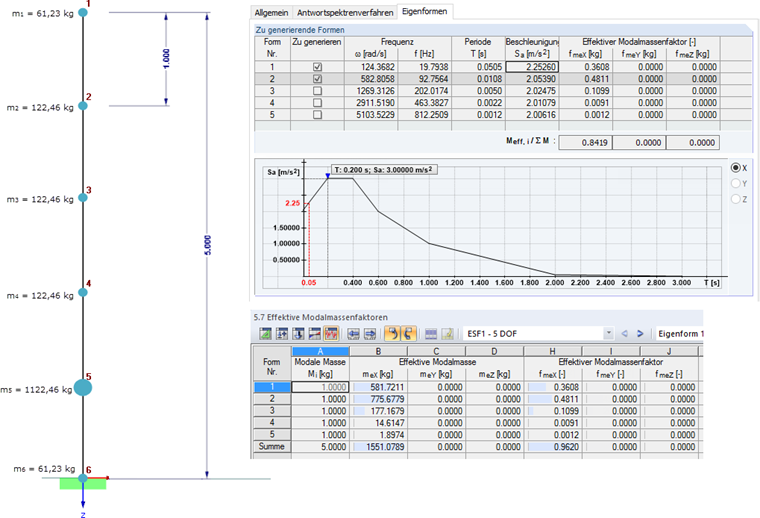
In this example, the ZPA value is Sa = 2.00 m/s². This is the acceleration value for the period T = 0 sec. If the response spectrum is compared with the frequencies, frequency fZPA results in 100 Hz when using the marginal value analysis. The first two frequencies, f1 = 19.8 Hz and f2 = 92.8 Hz, are therefore in the mid-frequency range (see Image 01) and are considered dynamically. The remaining three natural frequencies are high-frequency and can be taken into account with the ZPA method.
By default, the eigenvalue calculation in DYNAM Pro does not consider the masses of fixed supports. These masses have no influence on the determined natural frequencies, and only then is it possible to achieve effective modal mass factors of 100%.
However, if the influence of the masses in the supports should be explicitly considered with the ZPA method, it is necessary to activate them in DYNAM Pro with the setting shown in Image 04. In this example, the masses are taken into account in the supports.
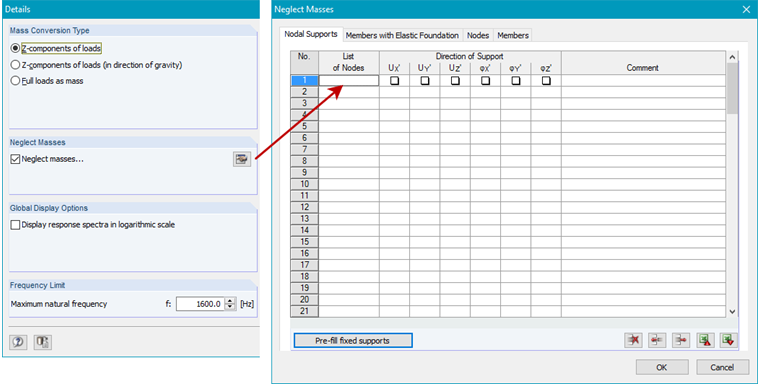
Enabling "Neglect masses" will change the default setting of the considered masses. If the "node storage" table is empty, masses are also taken into account on supports.
The following table shows the participation factors ΓX, the proportions of the activated masses mX, the proportions of the inactivated masses mX,missing, and the resulting equivalent loads at the six nodes in the system. The calculation bases of the ZPA method were discussed in the previous section.
| Node | Mass Mx | Participation Factor ΓX | Mode Shape uX | Components of Activated Masses mX | Components of Missing Masses mX,missing | Equivalent Loads FX [N] | ||
| Shape 1 | Shape 2 | Shape 1 | Shape 2 | |||||
| 1 | 61.23 | 0.078350 | -0.056290 | 0.3220 | 0.6780 | 83.03 | ||
| 2 | 122.46 | 0.056790 | -0.008520 | 1.1325 | -0.1325 | -32.44 | ||
| 3 | 122.46 | 24.12 | 27.85 | 0.036140 | 0.027190 | 1.6290 | -0.6290 | -154.05 |
| 4 | 122.46 | 0.018110 | 0.038290 | 1.5033 | -0.,5033 | -123.26 | ||
| 5 | 1,122.46 | 0,005100 | 0.021670 | 0.7266 | 0.2734 | 613.82 | ||
| 6 | 61.23 | 0.000000 | 0.000000 | 0.0000 | 1.0000 | 122.46 | ||
The shear force, moments, and support forces resulting from these equivalent loads are shown in Image 05.
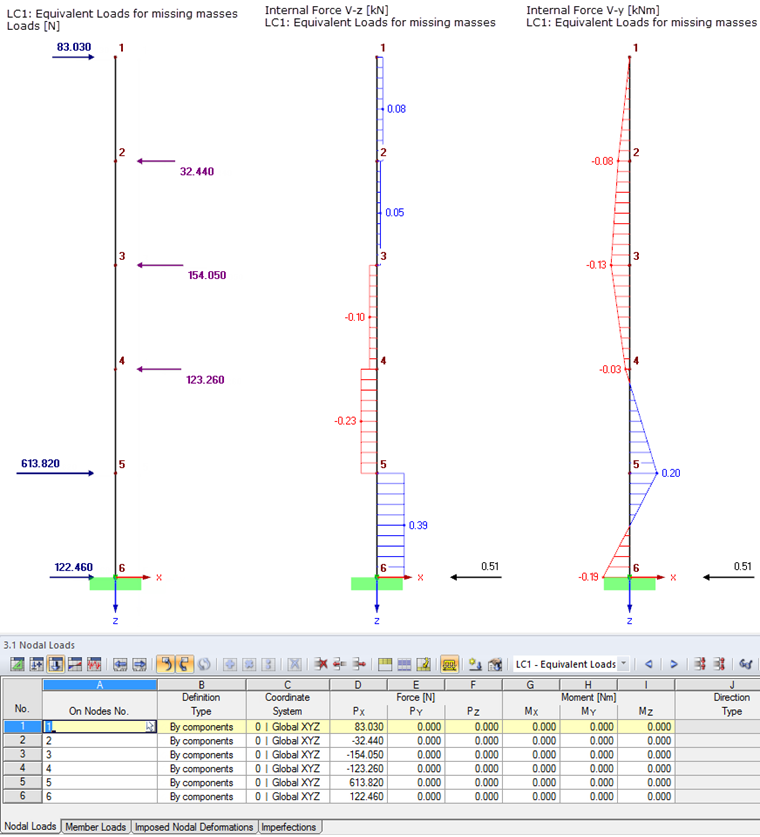
The final results of the multi-modal response spectrum analysis, taking into account the ZPA method, come from the results of the first two eigenvalues (here modally superimposed with the SRSS rule) and the results of the ZPA component (see Image 05).
Image 06 compares the results of the response spectrum analysis, taking into account the first two eigenvalues (DLC and LC2 in the model), and the final results, including the ZPA component (DLC3 and LC3 in the model). When looking at Image 05 and Image 06, the absolute summation used in DYNAM Pro can be seen clearly.
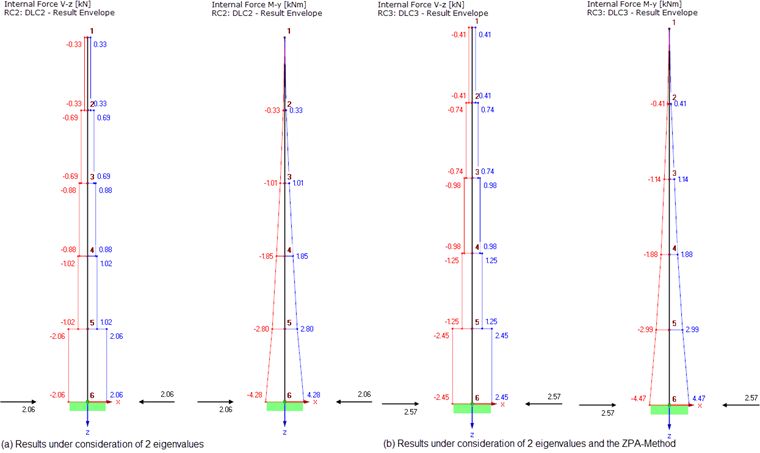
Image 07 shows the results of the response spectrum analysis, taking into account all five eigenvalues for comparison. The ZPA method considers the masses in the supports. This results in a larger bearing force, PX = 2.57 kN. The internal forces are on the safe side due to the superimposition as an absolute sum (compare Image 07 with Image 06).

Summary
This example showed how the ZPA method is implemented in DYNAM Pro and that the results are verifiably traceable. This method is useful and recommended when high-frequency frequencies of the structure activate the relevant mass components and when larger support masses are present in the structure.