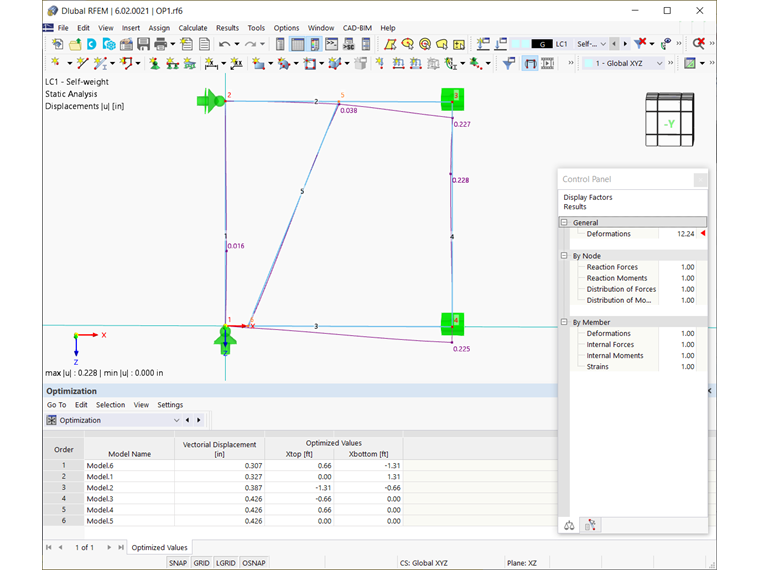
All optimization methods result in a list with the model mutations (variants) at the end of the process. There you will also find the governing optimization results, including the associated value assignment of the optimization parameters. This list is organized in descending order: At the top, it shows the assumed best solution, whose optimization result with the determined value assignment is closest to the optimization criterion.
In our example, the particle swarm was used as an optimizer and the number of random mutations was set to 30%. This means that 30% of the 25 possible mutations have been considered, resulting in seven different models with the optimized values. As already mentioned, the assumed best solution is shown in the first line.
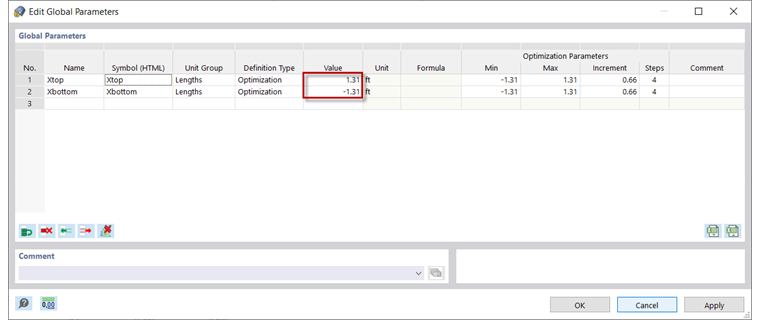
Furthermore, once the analysis is completed, the program will adjust the value assignment to that of the optimal solution for the optimization parameters in the global parameter list.