Answer:
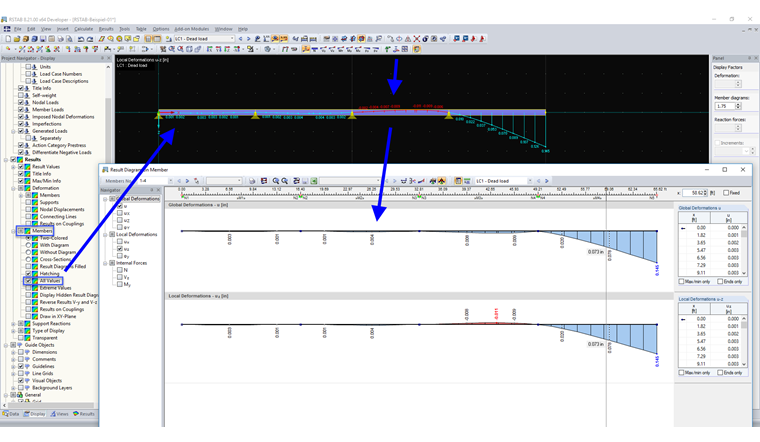
If the corresponding check box is selected in the Display navigator, all intermediate values for the local member deformations are displayed. The same applies to the result diagrams (see Image 01).
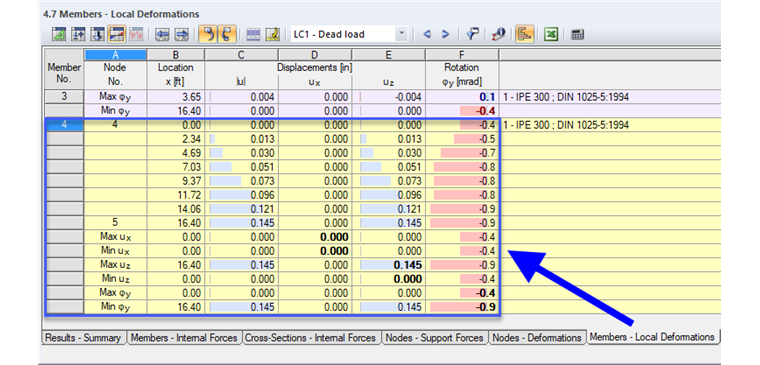
Depending on how many intermediate nodes are defined for the respective member, the result tables show not only the node values and maximum values, but also the corresponding deformation values at the division points (see Image 02).