


Yes, the Geo-Zone Tool on the website "Snow Load Zones, Wind Zones, and Seismic Zones" provides a web service in the background that can be used to generate raster graphics similar to the Geo-Zone Tool full-screen mode website for a location on the map and a load standard without opening the website.
WebService can be used for all load maps from the visible online service and is controlled by a URL address. An external process (your application) sends the request URL address to our server (Dlubal) and receives a raster graphic as a result. To ensure the process works, the URL address must contain all specifications for defining the parameters of load type, load standard, geolocation, zoom level, sea level, street, ZIP code, city, state, image activation, image format, image width, image height, display language, and user. It should be noted that this web service function assumes that the address data and the sea level were determined through a previous load data web service query of the same geolocation, and therefore the components of the raster image web service query described above will be completed with the previously determined data. The final URL is then composed of these components.
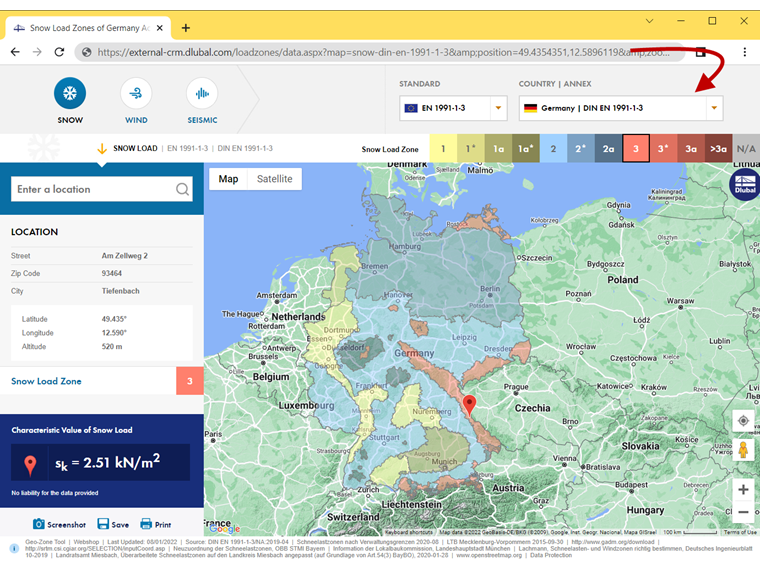
The load type and the standard are defined by the "map" component. The first part describes the load type (for example, snow, wind, or earthquake) and the second part describes the standard (for example, din‑en‑19911‑3).
→ map=snow-din-en-1991-1-3
The geolocation is defined by the "position" component. The "position" entry describes the geolocation using the geographic coordinates in the format [latitude in °, longitude in °].
→ position=49.4354351,12.5896119
The zoom level is defined by the "zoom" component. This setting controls the zoom setting of the map itself. The map scale becomes larger when increasing the zoom level.
→ zoom=10
The sea level of the geolocation is defined by the "altitude" component. This entry specifies the sea level data in the location component of the image and is specified in the SI unit [m].
→ altitude=520
The assignment of the street and house number of the geolocation is defined by the "street" component. This entry specifies the street name in the location component of the image.
→ street=Zellweg 2
The assignment of a ZIP code of the geolocation is defined by the "zip" component. The entry specifies the ZIP code in the location component of the image.
→ zip=93464
The city assignment of the geolocation is defined by the "city" component. The entry specifies the city in the location component of the image.
→ city=Tiefenbach
The state assignment of the geolocation is defined by the "state" component. In the case of load information for the US, this entry specifies the state in the location component of the image.
→ state=NA
The image activation is defined by the "picture" component. This specification determines whether the web service displays the resulting load information of the defined geolocation as a CSV data record, or as an image of the map section with the location description and load output. The image output can be activated using the value 1.
→ picture=1
The image format is defined by the "picformat" component. The entry determines the format in which the raster image is displayed by the web service. The web service provides the formats JPG, PNG, and PDF. The format is defined by an abbreviation (jpg for the JPG format, png for the PNG format, and pdf for the PDF format).
→ picformat=png
The image width is defined by the "width" component. The entry specifies the width of the raster image in the unit [px].
→ width=1200
The image height is defined by the "height" component. The entry controls the height of the raster image in the unit [px].
→ height=900
The display language of the results is defined by the "language" component. The language is defined by an abbreviation (de - German, en - English, and so on).
→ language=en
The identity of the user is defined using the "login" and "hash" components. The "login" component describes the user's email address and the "hash" component describes a hidden password. To ensure that the login works, it is necessary to save the email address in a valid Dlubal account. The associated "hash" component is obtained in your Dlubal account.
→ hash=xyz
A request URL can finally be generated from these components and sent to our server.
After having sent the data, the server returns a map cutout with the address component and the load information as a raster graphic for the defined geolocation.
Furthermore, the following “hash” parameter can be added to download the image:
→ download=1
The “mapareaonly” hash parameter ensures that only the map is used. The “cropwidth” and “cropheight” parameters can be used to adjust the image section.
→ mapareaonly=1
→ cropwidth=1000
→ cropheight=720
In order to send such grid graphics to our server without restrictions, a Geo-Zone Tool package is required. This Geo-Zone Tool package includes a certain number of data requests. Each query reduces the number of available requests purchased within the package.
Since the WebService is linked with the purchased data package, it is necessary to deal carefully with the identity components and request URL with regard to data protection. For example, you should always ensure that the request URL with the identity components is not provided to unauthorized third parties.