
Did you know that you can also display the moment-axial force interaction diagrams (M‑N diagrams) graphically? This allows you to display the cross-section resistance in the case of an interaction of a bending moment and an axial force. In addition to the interaction diagrams related to the cross-section axes (My‑N diagram and Mz‑N diagram), you can also generate an individual moment vector to create an Mres‑N interaction diagram. You can display the section plane of the M‑N diagrams in the 3D interaction diagram. The program displays the corresponding value pairs of the ultimate limit state in a table. The table is dynamically linked to the diagram so that the selected limit point is also displayed in the diagram.
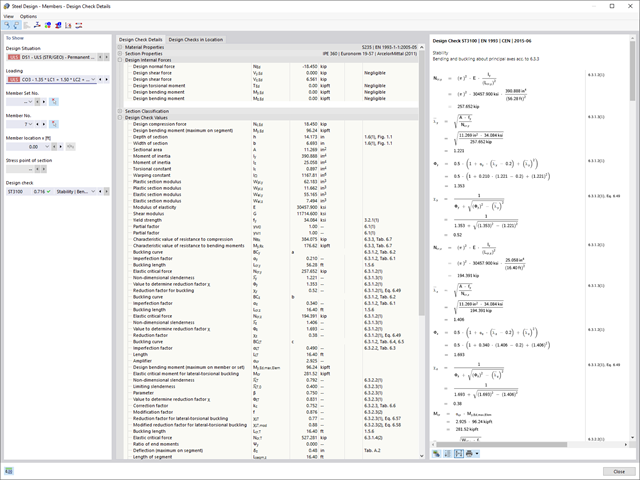
With Dlubal Software, you always have an overview, regardless of whether your projects are from the reinforced concrete, steel, timber, aluminum, or other industry. The program clearly displays the design check formulas used in your design (including a reference to the used equation from the standard). These design check formulas can also be included in the printout report.
Go to Explanatory Video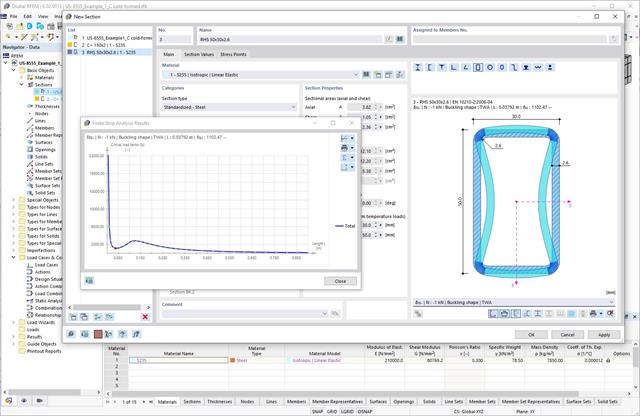
When performing a design according to EN 1993‑1‑3, it is possible to graphically display a mode shape for the distortional buckling of a cross-section, and for the RSECTION cross-sections.
The mode shape can also be output in RSECTION 1 for library cross-sections.

Reinforced concrete usually answers the question "How much can you carry?" simply with "Yes". Nevertheless, you need a three-dimensional moment-moment-axial force interaction diagram for the graphical output of the ultimate limit state of reinforced concrete cross-sections. The Dlubal structural analysis software offers you just that.
With the additional display of the load action, you can easily recognize or visualize whether the limit resistance of a reinforced concrete cross-section is exceeded. Since you can control the diagram properties, you can customize the appearance of the My-Mz-N diagram to suit your needs.
Do you work with the structural components consisting of slabs? In that case, you have to perform the shear force design with the requirements of punching shear design, for example, according to 6.4, EN 1992‑1‑1. In addition to floor slabs, you can also design foundation slabs in this way.
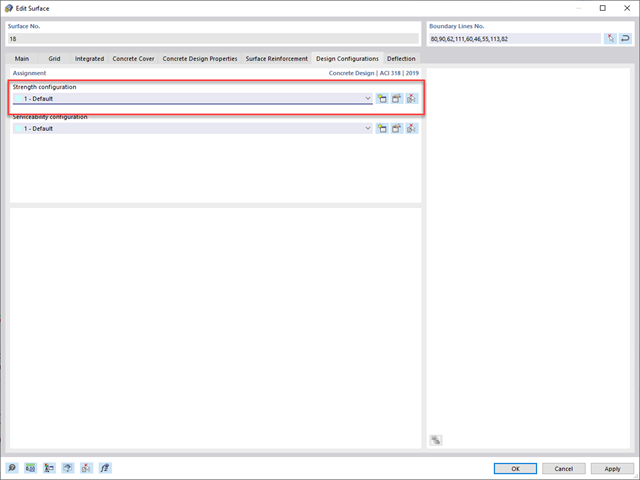
In the Ultimate Configuration for concrete design, you can define the punching design parameters for the selected nodes.
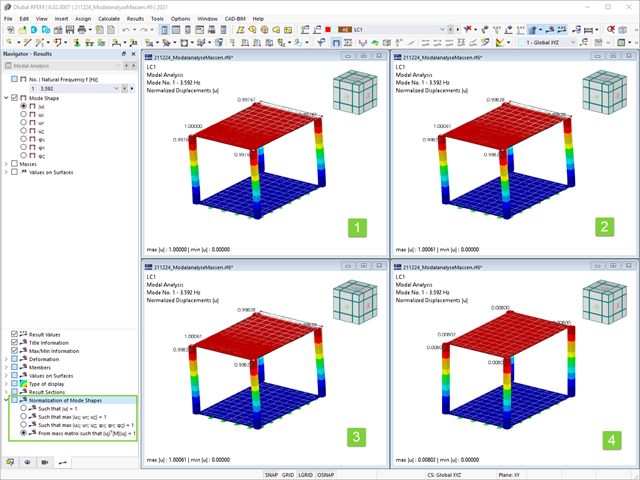
As you've already learned, the results of a Modal Analysis load case are displayed in the program after a successful calculation. You can thus immediately see the first mode shape graphically or as an animation. You can also easily adjust the representation of the mode shape standardization. Do that directly in the Results navigator, where you have one of four options for the visualization of the mode shapes available for the selection:
- Scaling the value of the mode shape vector uj to 1 (considers the translation components only)
- Selecting the maximum translational component of the eigenvector and setting it to 1
- Considering the entire eigenvector (including the rotation components), selecting the maximum, and setting it to 1
- Setting the modal mass mi for each mode shape to 1 kg
You can find a detailed explanation of the mode shape standardization in the OnlineManual here.
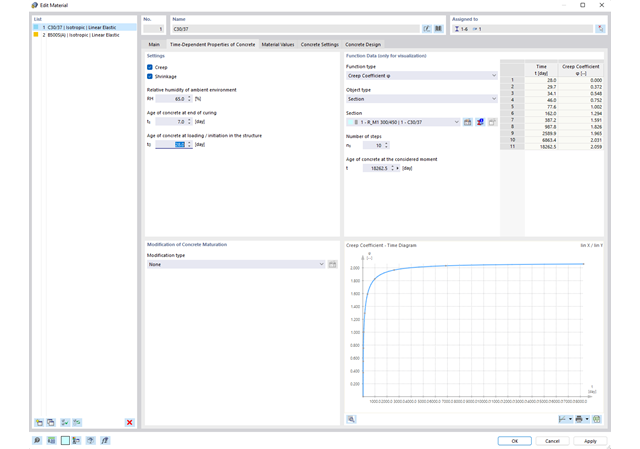
Time-dependent concrete properties, such as creep and shrinkage, are very important for your calculation. You can define them directly for the material in the structural analysis program. In the input dialog box, the time course of the creep or shrinkage function is displayed to you graphically. You can easily select the modification of the applied concrete age, for example, due to a temperature treatment.
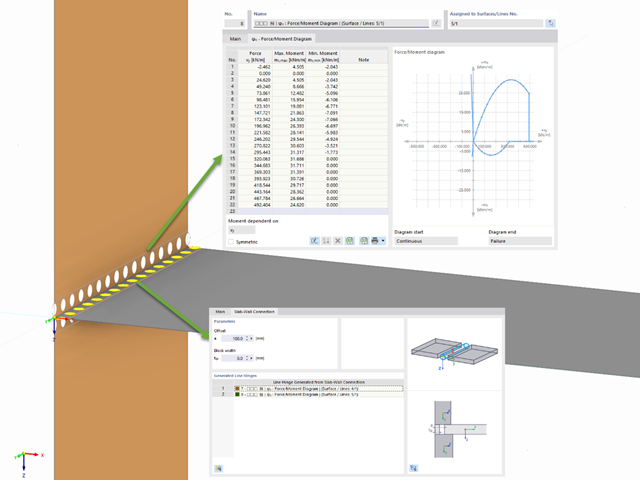
RFEM allows you to use a special line hinge to model the special properties of the connection between the reinforced concrete slab and masonry wall. This limits the transferable forces of the connection depending on the specified geometry. You guess right: This means that the material cannot be overloaded.
The program develops interaction diagrams that are applied automatically. They represent the various geometric situations and you can use them to determine the correct stiffness.
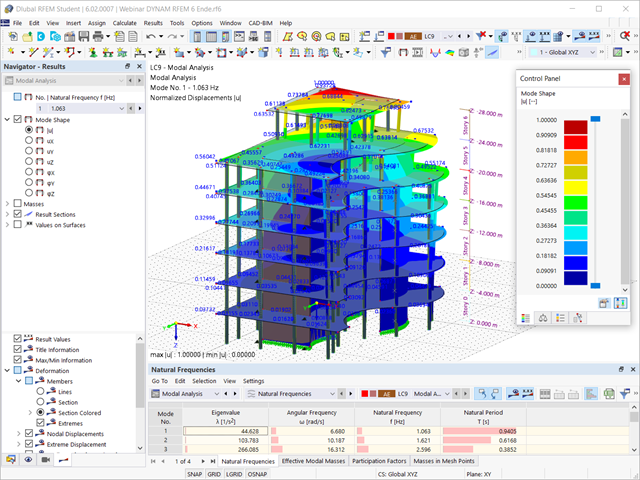
Is the calculation finished? The results of the modal analysis are then available both graphically and in tables. Display the result tables for the load case or the load cases of the modal analysis. Thus, you can see the eigenvalues, angular frequencies, natural frequencies, and natural periods of the structure at first glance. The effective modal masses, modal mass factors, and participation factors are also clearly displayed.
.png?mw=640&hash=5a991f211d984ac624978f514e70c53da263e5d9)
Depending on the axial force N, you can generate a moment curvature line for any moment vector. The program also shows you the value pairs of the displayed diagram in a table. Furthermore, you can activate the secant stiffness and tangent stiffness of the reinforced concrete cross-section, belonging to the moment curvature diagram, as an additional diagram.
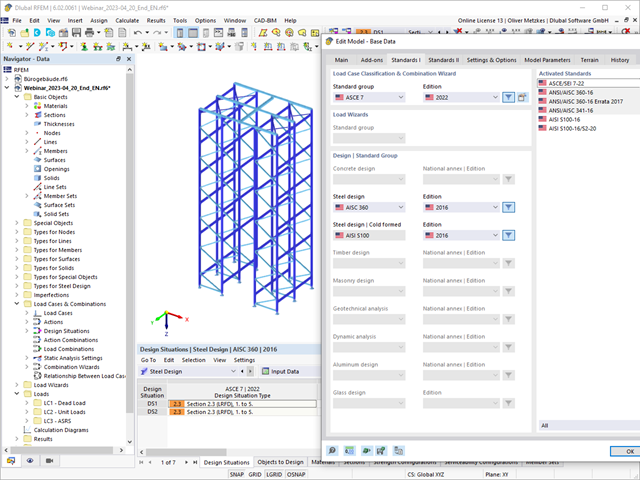
The design of cold-formed steel members according to the AISI S100-16 / CSA S136-16 is available in RFEM 6. Design can be accessed by selecting “AISC 360” or “CSA S16” as the standard in the Steel Design Add-on. “AISI S100” or “CSA S136” is then automatically selected for the cold-formed design.
RFEM applies the Direct Strength Method (DSM) to calculate the elastic buckling load of the member. The Direct Strength Method offers two types of solutions, numerical (Finite Strip Method) and analytical (Specification). The FSM signature curve and buckling shapes can be viewed under Sections.
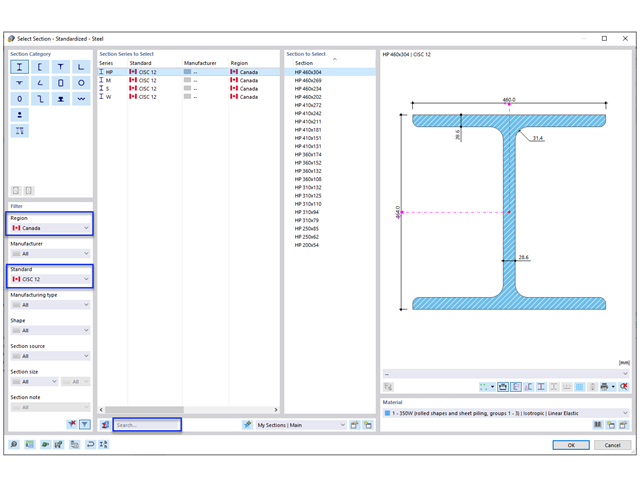
The new steel sections according to the latest CISC Handbook (12th edition) are available in RFEM 6. The sections are listed in the Standardized library. In the filter, select “Canada” for the region and “CISC 12” for the standard. Alternatively, the section name can be directly entered in the search box located at the bottom of the dialog box.
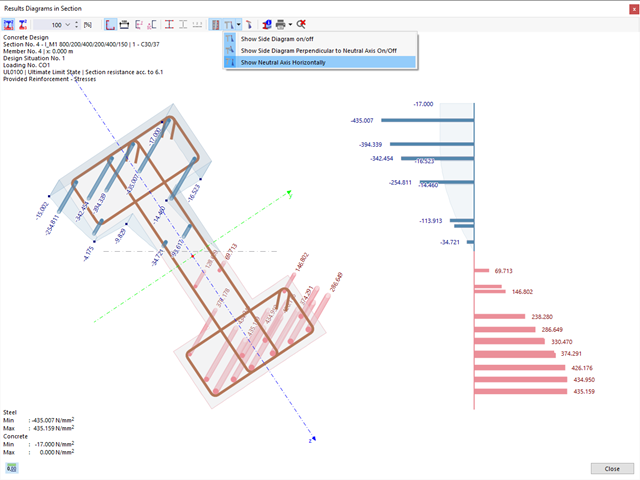
You can display the existing stresses and strains of a concrete cross-section and the reinforcement as a 3D stress image or 2D graphic. Depending on which results do you select in the result tree of the design details, the stresses or strains are displayed to you in the defined longitudinal reinforcement under the load actions or the limit internal forces.
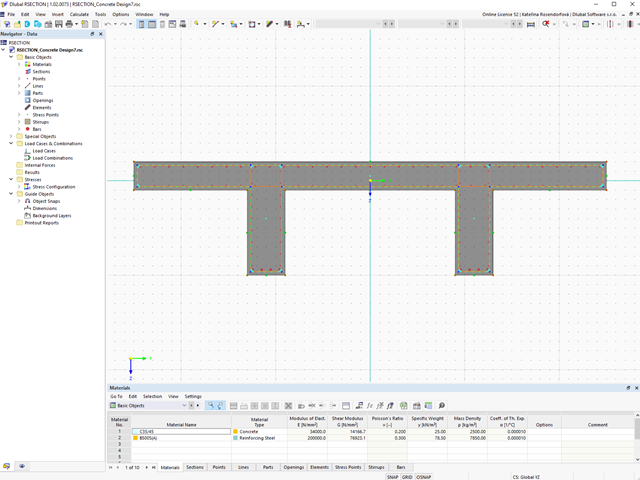
In the Concrete Design add-on, you can design any RSECTION cross-section. Define the concrete cover, shear force, and longitudinal reinforcement directly in RSECTION.
After importing the reinforced RSECTION cross-section into RFEM 6 or RSTAB 9, you can use it for design in the Concrete Design add-on.
Go to Explanatory Video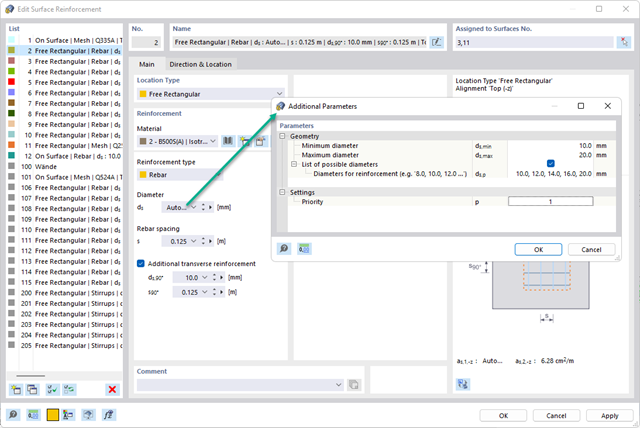
You have the option to automatically design the existing surface reinforcement to cover the required reinforcement. You can also select whether to automatically define the reinforcement diameter or the member spacing.
Go to Explanatory Video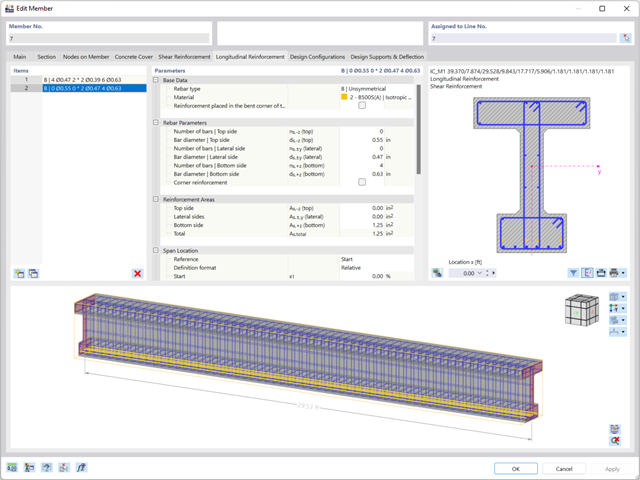
You can specify the shear and longitudinal reinforcement individually for each member. In this case, there are various templates available for entering the reinforcement.
You determine the deformation for members and surfaces, taking into account the cracked (state II) or non-cracked (state I) reinforced concrete cross-section. When determining the stiffness, you can consider "tension stiffening" between the cracks according to the design standard used.

Do you want to determine the biaxial bending resistance of a reinforced concrete cross-section? For this, you have to activate a moment-moment interaction diagram (My-Mz diagram) first. This My-Mz diagram represents a horizontal section through the three-dimensional diagram for the specified axial force N. Due to the coupling to the 3D interaction diagram, you can also visualize the section plane there.
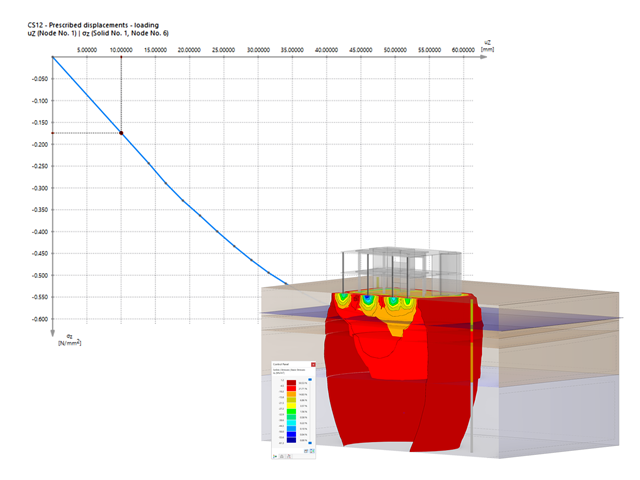
Are you ready for the evaluation? Use the calculation diagrams, which show the distribution of a specific result during the calculation.
You can freely define the layout of the vertical and horizontal axes of the calculation diagram. This allows you, for example, to consider the settlement distribution of a certain node, depending on the load.
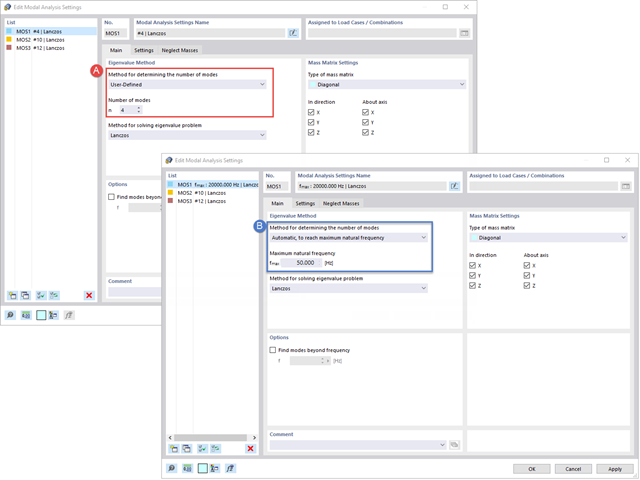
Is your goal to determine the number of mode shapes? The program offers you two methods for this. On the one hand, you can manually define the number of the smallest mode shapes to be calculated. In this case, the number of available mode shapes depends on the degrees of freedom (that is, the number of free mass points multiplied by the number of directions in which the masses act). However, it is limited to 9999. On the other hand, you can set the maximum natural frequency the way that the program determined the mode shapes automatically until reaching the natural frequency set.