61 Results
View Results:
Sort by:

You can neglect openings with a certain area in the building model calculation. This function can be activated in the global settings of the building stories. A warning message appears saying that the openings have been neglected.
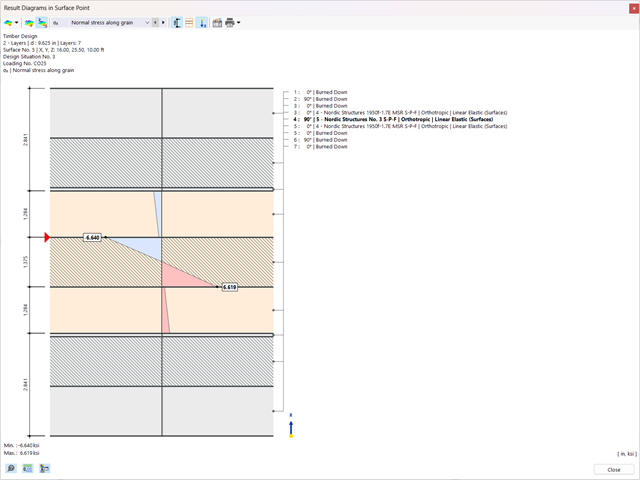
You have the option to perform the fire resistance design of surfaces using the reduced cross-section method. The reduction is applied over the surface thickness. It is possible to perform the design checks for all timber materials allowed for the design.
For cross-laminated timber, depending on the type of adhesive, you can select whether it is possible for individual carbonized layer parts to fall off, and whether you can expect increased charring in certain layer areas.
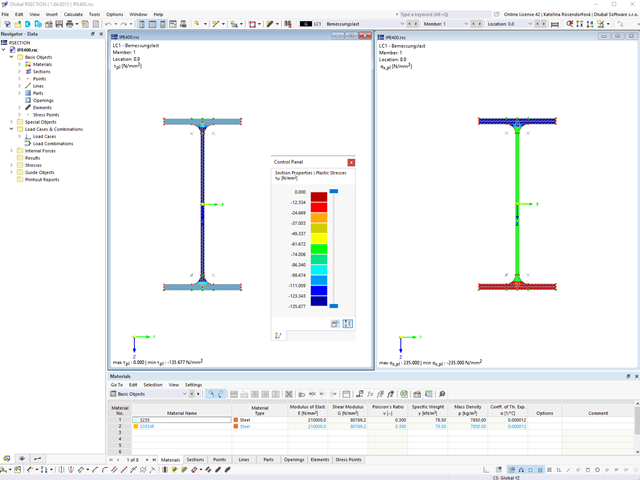
Within the "Plastic capacity design | Simplex Method" in RSECTION, the simultaneous variation of shear stresses over the cross-sectional area is performed in addition to the variation of axial stresses. This extended form of analysis allows you to use redistribution reserves, especially for the cross-sections subjected to shear loading, thus loading the cross-sections even more efficiently.
Go to Explanatory Video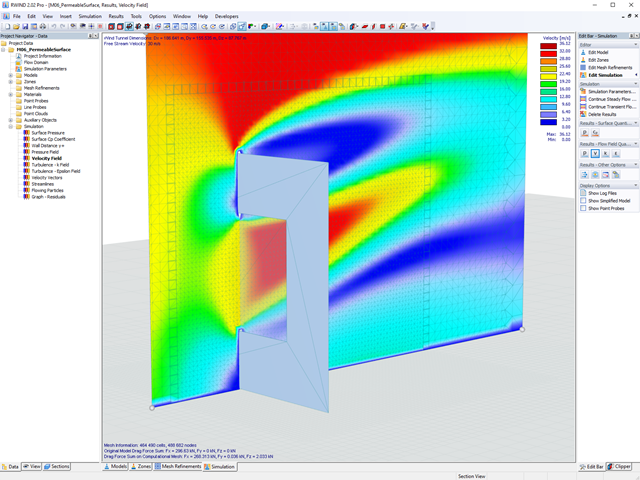
Use RWIND 2 Pro to easily apply a permeability to a surface. All you need is the definition of
- the Darcy coefficient D,
- the inertial coefficient I, and
- the length of the porous medium in the direction of flow L,
to define a pressure boundary condition between the front and back of a porous zone. Due to this setting, you obtain the flow through this zone with a two-part result display on both sides of the zone area.
But that's not all. Furthermore, the generation of a simplified model recognizes permeable zones and takes into account the corresponding openings in the model coating. Can you waive an elaborate geometric modeling of the porous element? Understandable – we have good news for you then! With a pure definition of the permeability parameters, you can avoid complex geometric modeling of the porous element. Use this feature to simulate permeable scaffolding, dust curtains, mesh structures, and so on.
More Information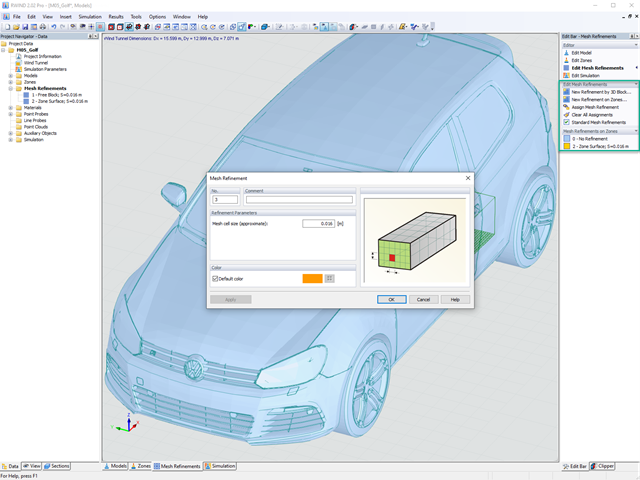
Do you already know the editor for mesh refinement control? It is a great help for your work! Why? It's easy – it gives you the following options:
- Graphic visualization of the areas with mesh refinements
- Mesh refinement of zones
- Deactivating the standard 3D solid mesh refinement with transversion into the corresponding manual 3D mesh refinements.
These options help you to formulate a suitable rule for meshing the entire model, even for the models with unusual dimensions. Use the editor to efficiently define small model details on large buildings or detailed meshing areas in the coating area of the model. You will be amazed!
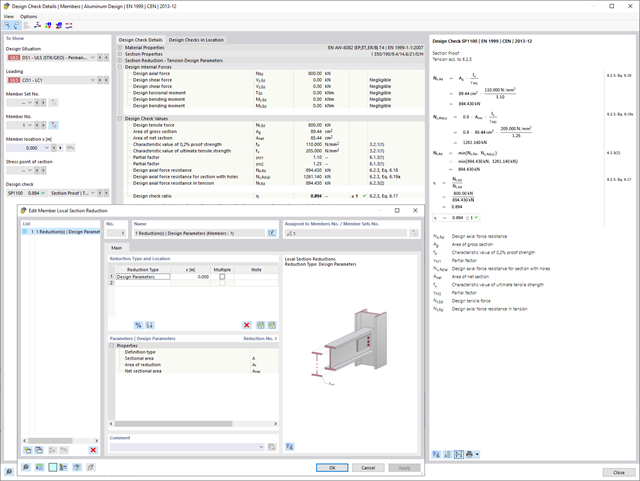
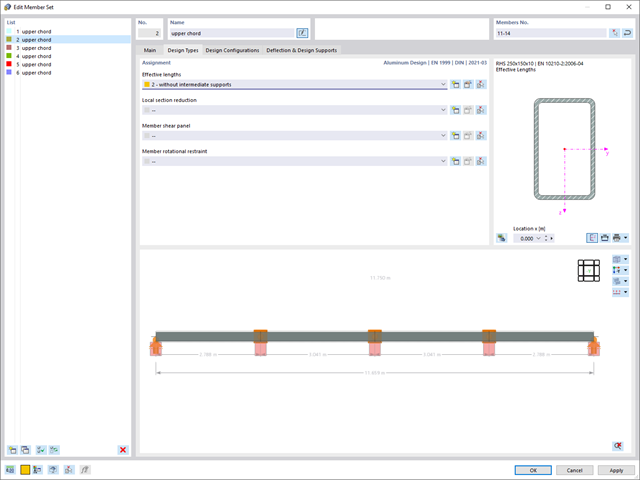
You know for sure that when connecting tension-loaded components with bolted connections, you need to consider the cross-section reduction due to the bolt holes in the ultimate limit state design. The structural analysis programs also have a solution for this. In the Aluminum Design add-on, you can enter a member local section reduction for this. Enter the reduction of the cross-section as an absolute value or as a percentage of the total area at all relevant locations.
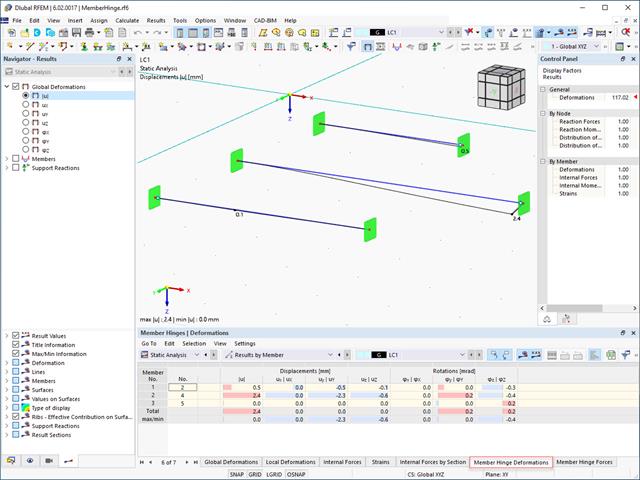
The results for members can be displayed graphically, using the Member Hinges navigator category. The numerical results of member hinges can be found in the Results by Member table category. The Member Hinge Deformations and Member Hinge Forces tables are available for the analysis and documentation of the deformation and force results in the area of member hinges.
The table lists the deformations and forces of each member for the locations specified in the Results Table Manager. There, you can also control which extreme values are displayed.
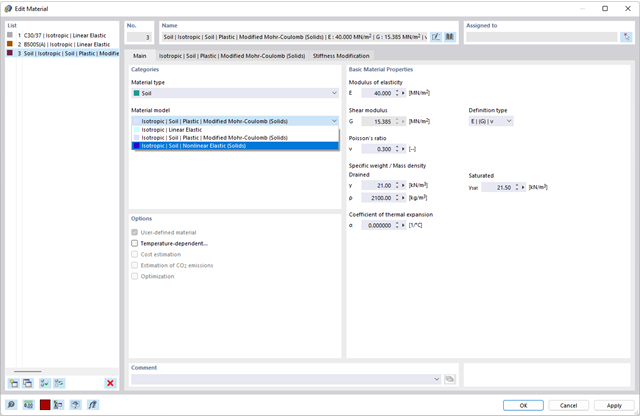
Do you want to model and analyze the behavior of a soil solid? To ensure this, special suitable material models have been implemented in RFEM.
You can use the modified Mohr-Coulomb model with a linear-elastic ideal-plastic model or a nonlinear elastic model with an oedometric stress-strain relation. The limit criterion, which describes the transition from the elastic area to that of the plastic flow, is defined according to Mohr-Coulomb.
Your options in timber design are diverse. You can consider cut-to-grain angles, transverse tension stresses, and volume-dependent radii of curvature for tapered and curved members. To design the area of the grain cut, the strength is adjusted accordingly in the case of bending tension or bending pressure. In order to also allow you to perform a stability analysis with the equivalent member method, the height to determine the effective and lateral-torsional buckling lengths is set at a distance of 0.65 × h to the actual design point.
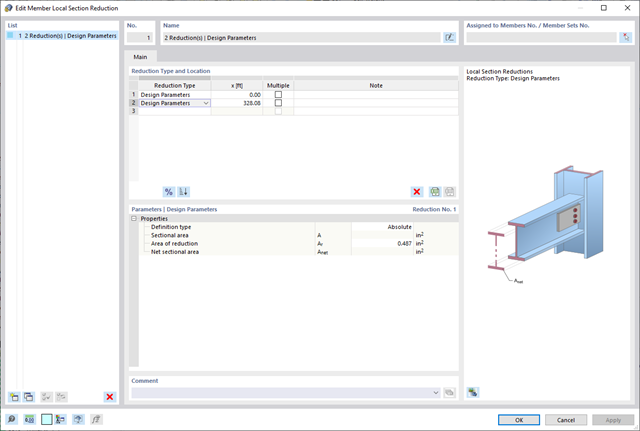
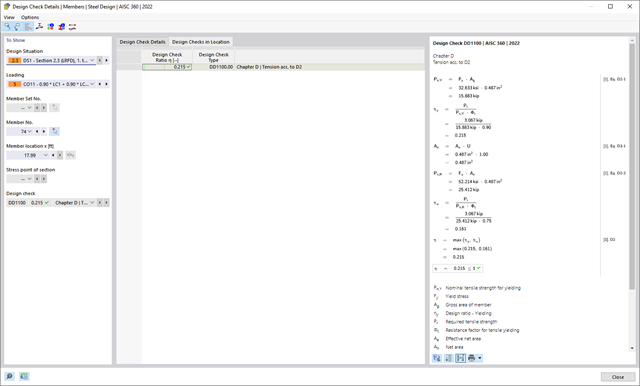
Please note that when connecting tension-loaded components with bolted connections, you need to consider the cross-section reduction due to the bolt holes in the ultimate limit state design. But don't worry, this can be easily done in the program. In the Steel Design add-on, you can enter a member local section reduction – and that's it. You can enter the reduction of the cross-section as an absolute value or as a percentage of the total area at all relevant locations.
.png?mw=640&hash=342149908caead326e60e26a2b5d05f7f46825cb)
Are you familiar with the Tsai-Wu material model? It combines plastic and orthotropic properties, which allows for special modeling of materials with anisotropic characteristics, such as fiber-reinforced plastics or timber.
If the material is plastified, the stresses remain constant. The redistribution is carried out according to the stiffnesses available in the individual directions. The elastic area corresponds to the Orthotropic | Linear Elastic (Solids) material model. For the plastic area, the yielding according to Tsai-Wu applies:
All strengths are defined positively. You can imagine the stress criterion as an elliptical surface within a six-dimensional space of stresses. If one of the three stress components is applied as a constant value, the surface can be projected onto a three-dimensional stress space.
If the value for fy(σ), according to the Tsai-Wu equation, plane stress condition, is smaller than 1, the stresses are in the elastic zone. The plastic area is reached as soon as fy (σ) = 1; values greater than 1 are not allowed. The model behavior is ideal-plastic, which means there is no stiffening.

Did you know? In contrast to other material models, the stress-strain diagram for this material model is not antimetric to the origin. You can use this material model to simulate the behavior of steel fiber-reinforced concrete, for example. Find detailed information about modeling steel fiber-reinforced concrete in the technical article about Determining the material properties of steel-fiber-reinforced concrete.
In this material model, the isotropic stiffness is reduced with a scalar damage parameter. This damage parameter is determined from the stress curve defined in the Diagram. The direction of the principal stresses is not taken into account. Rather, the damage occurs in the direction of the equivalent strain, which also covers the third direction perpendicular to the plane. The tension and compression area of the stress tensor is treated separately. In this case, different damage parameters apply.
The "Reference element size" controls how the strain in the crack area is scaled to the length of the element. With the default value zero, no scaling is performed. Thus, the material behavior of the steel fiber concrete is modeled realistically.
Find more information about the theoretical background of the "Isotropic Damage" material model in the technical article describing the Nonlinear Material Model Damage.
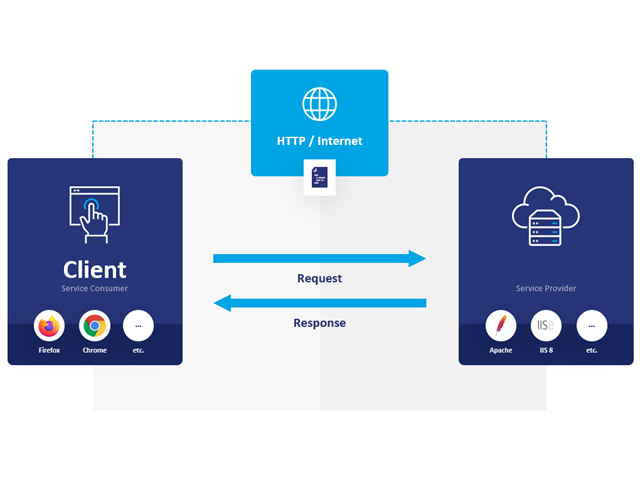
WebService and API provide you various scope of application. We have summarized some ideas as to how WebService and API can support your company:
- Creating additional applications for RFEM 6, RSTAB 9, and RSECTION 1
- Possibility to make the workflows more efficient (for example, model definition and input) and to integrate RFEM 6, RSTAB 9, and RSECTION 1 into your company applications
- Simulating and calculating several design options
- Running optimization algorithms for size, shape, and/or topology
- Accessing the calculation results
- Generation of printout reports in the PDF format
The level of quality of the work is automatically increased not only by the algorithmic model definitions, but also by:
- Extending / consolidating RFEM 6, RSTAB 9, and RSECTION 1 with your own controls
- Increased interoperability between the individual software used to complete a project
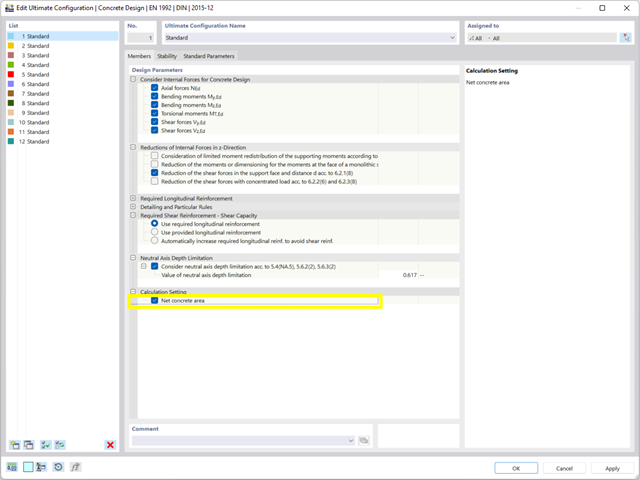
During the cross-section design, you can directly control whether the concrete surface is applied behind the reinforcing bars or is subtracted from the concrete cross-section. You can use the design of the net concrete cross-section especially in the case you deal with a highly reinforced cross-section.
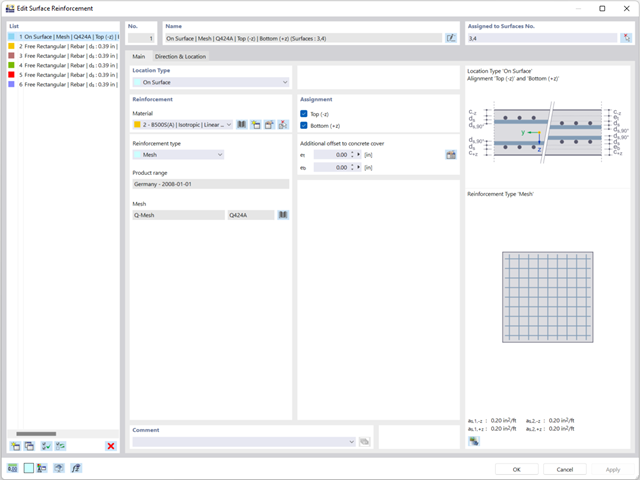
Enter the surface reinforcement directly on the RFEM level. In this case, you can select the defined area reinforcements individually. The usual editing functions Copy, Mirror, or Rotate are at your disposal when entering the surface reinforcement.
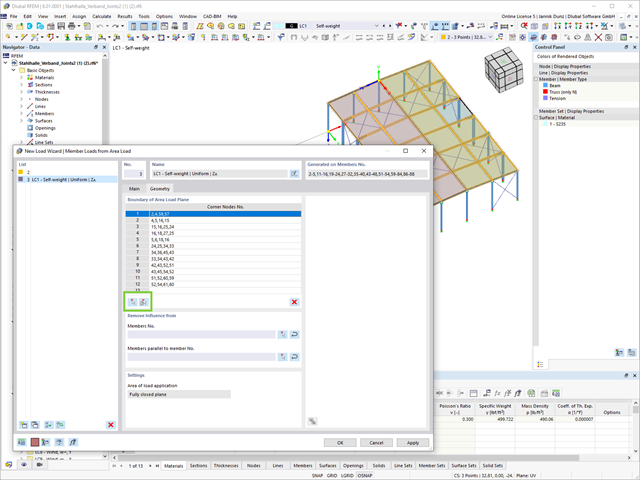
Another useful features in the Load Wiyard is the determination of member loads from area loads by defining surfaces (using corner nodes) and cells in a definition.
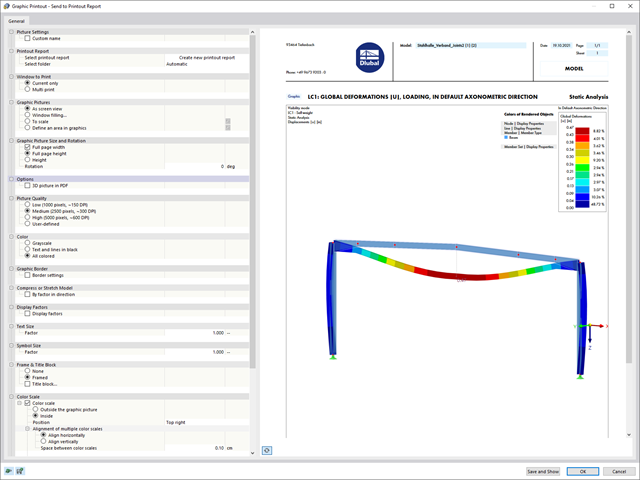
Various new options make it easier for you to print graphics in the future. Your new graphic printout dialog now includes:
- Library-controlled mass print function for all program graphics
- User-defined print area selection
- 3D function for later 3D functionalities in the final PDF
- Automatic separation of images for scale prints and the function for displaying an overview image
- 002108
- General
- Optimization & Cost / CO2 Emission Estimation for RFEM 6
- Optimization & Cost / CO2 Emission Estimation for RSTAB 9
- Artificial intelligence technology (AI): Particle swarm optimization (PSO)
- Structure optimization according to the minimum weight or deformation
- Use of any number of optimization parameters
- Specification of variable ranges
- Optimization of cross-sections and materials
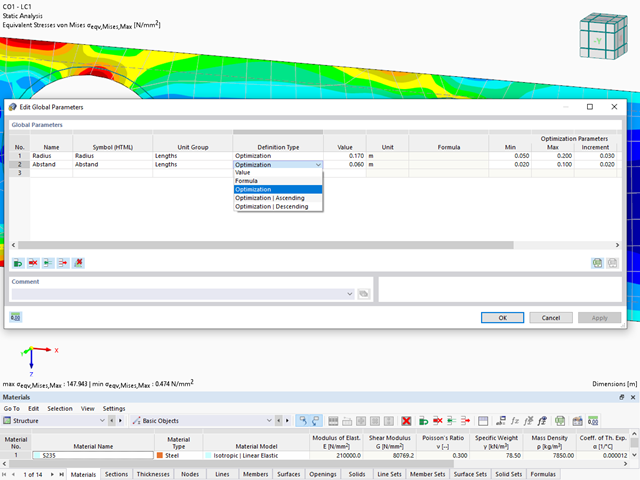
- Parameter definition types
- Optimization | Ascending or Optimization | Descending
- Application of parametric models and blocks
- Code-based JavaScript parametrization of blocks
- Optimization taking into account the design results
- Tabular display of the best model mutations
- Real-time display of the model mutations in the optimization process
- Model cost estimation by specifying unit prices
- Determination of the global warming potential GWP when realizing the model by estimating the CO2 equivalent
- Specification of weight-, volume-, and area-based units (price and CO2e)
- 002109
- General
- Optimization & Cost / CO2 Emission Estimation for RFEM 6
- Optimization & Cost / CO2 Emission Estimation for RSTAB 9
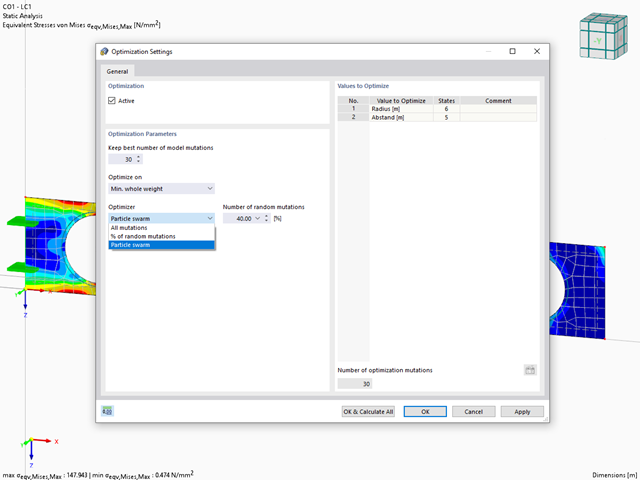
Did you know? The structural optimization in the programs RFEM and RSTAB is a completion of the parametric input. It is a parallel process beside the actual model calculation with all its regular calculation and design definitions. The add-on assumes that your model or block is built with a parametric context and is controlled in its entirety by global control parameters of the "optimization" type. Therefore, these control parameters have a lower and upper limit and a step size to delimit the optimization range. If you want to find optimal values for the control parameters, you have to specify an optimization criterion (for example, minimum weight) with the selection of an optimization method (for example, particle swarm optimization).
You can already find the cost and CO2 emission estimation in the material definitions. You can activate both options individually in each material definition. The estimation is based on a unit for unit cost or unit emission for members, surfaces, and solids. In this case, you can select whether to specify the units by weight, volume, or area.
- 002110
- General
- Optimization & Cost / CO2 Emission Estimation for RFEM 6
- Optimization & Cost / CO2 Emission Estimation for RSTAB 9
There are two methods that you can use for the optimization process, with which you can find optimal parameter values according to a weight or deformation criterion.
The most efficient method with the littlest calculation time is the near-natural particle swarm optimization (PSO). Have you heard or read about it? This artificial intelligence (AI) technology has a strong analogy to the behavior of flocks of animals, looking for a resting place. In such swarms, you can find many individuals (cf. optimization solution - for example, weight) who like to stay in a group and follow the group movement. Let's assume that each individual swarm member has a need to rest at an optimal resting place (cf. best solution - for example, lowest weight). This need increases as the resting place is approached. Thus, the swarm behavior is also influenced by the properties of the space (cf. result diagram).
Why the excursion into biology? Quite simply – the PSO process in RFEM or RSTAB proceeds in a similar way. The calculation run starts with an optimization result from a random assignment of the parameters to be optimized. It repeatedly determines new optimization results with varied parameter values, which are based on the experience of the previously performed model mutations. The process continues until the specified number of possible model mutations is reached.
As an alternative to this method, the program also offers you a batch processing method. This method attempts to check all possible model mutations by randomly specifying the values for the optimization parameters until a predetermined number of possible model mutations is reached.
After calculating a model mutation, both variants also check the respective activated design results of the add-ons. Furthermore, they save the variant with the corresponding optimization result and value assignment of the optimization parameters if the utilization is < 1.
You can determine the estimated total costs and emission from the respective sums of the individual materials. The sums of the materials are composed of the weight-based, volume-based, and area-based partial sums of the member, surface, and solid elements.
Was your design successful? Then just sit back and relax. You benefit from the numerous functions in RFEM also here. The program gives you the maximum stresses of the masonry surfaces, whereby you can display the results in detail at each FE mesh point.
Moreover, you can insert sections in order to carry out a detailed evaluation of the individual areas. Use the display of the yield areas to estimate the cracks in the masonry.

- 002161
- General
- Optimization & Cost / CO2 Emission Estimation for RFEM 6
- Optimization & Cost / CO2 Emission Estimation for RSTAB 9
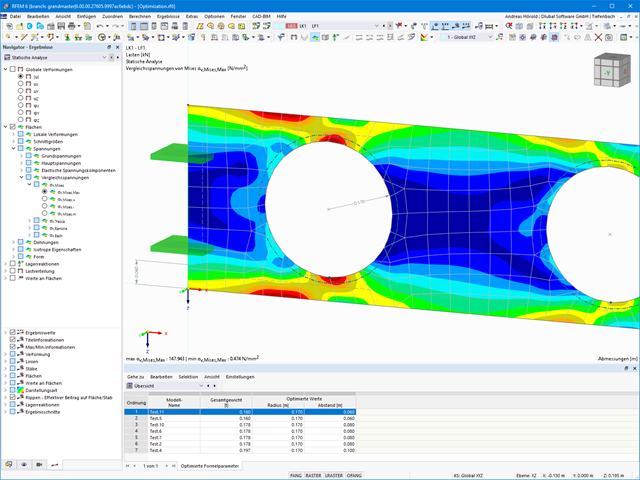
Both optimization methods have one thing in common. At the end of the process, they provide you with a list of model mutations from the stored data. Here you can find the details of the controlling optimization result and the associated value assignment of the optimization parameters. This list is organized in descending order. You can find the assumed best solution shown in the first line. For this, the optimization result with its determined value assignment is closest to the optimization criterion. All add-on results have a utilization < 1. Furthermore, once the analysis is completed, the program will adjust the value assignment to that of the optimal solution for the optimization parameters in the global parameter list.
In the material dialog boxes, you can find the additional tabs "Cost Estimation" and "Estimation of CO2 Emissions". They show you the individual estimated sums of the assigned members, surfaces, and solids per unit weight, volume, and area. Furthermore, these tabs show the total cost and emission of all assigned materials. This gives you a good overview of your project.
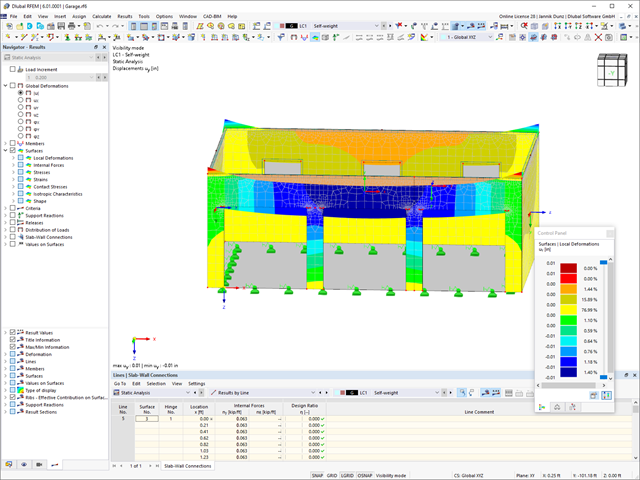
Have you carried out the design successfully? The results of the deformation analysis are now listed in clearly arranged output tables or detailed dialog boxes with info text. The program shows you all intermediate values in a comprehensible manner. Graphical representation of design ratios and deformation in RFEM allows you for a quick overview of critical areas.
Due to the results output of the design checks with all intermediate results, you can follow the calculation to the smallest detail. The complete integration of results in the RFEM printout report ensures that you obtain verifiable structural design.
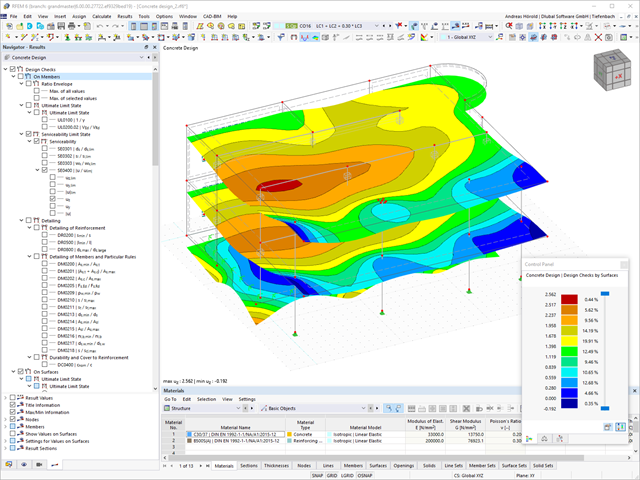
RFEM supports you and save you a lot of work. The materials and surface thicknesses defined in RFEM are already preset in the Concrete Design add-on. Thus, you can directly define the nodes to be designed.
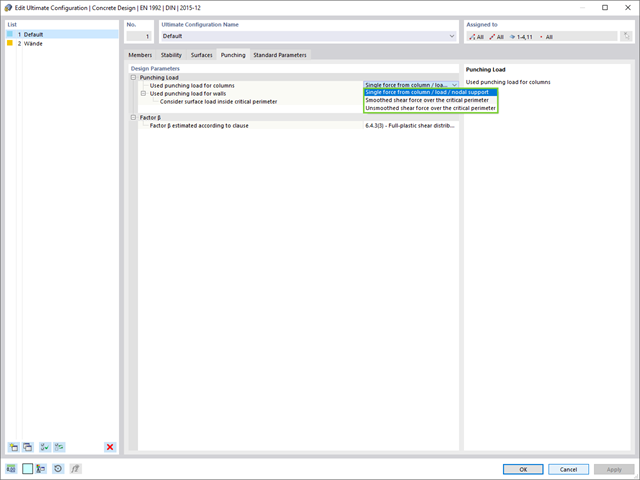
Any openings in the area with risk of punching shear are automatically taken into account in the RFEM model. The add-on recognizes the position of the nodes of punching shear and automatically determines whether it is a node of punching shear in the center of the slab, on the edge of the slab, or in a slab corner. Again, you save your time.
You can individually select the method for determining the load increment factor β.
- Design of tension, compression, bending, shear, torsion, and combined internal forces
- Tension design with consideration of a reduced section area (for example, hole weakening)
- Automatic classification of cross-sections to check local buckling
- Internal forces from the calculation with Torsional Warping (7 DOF) are taken into account by means of the equivalent stress check (currently not for the design standards AISC 360‑16 and GB 50017).
- Design of cross-sections of Class 4 with effective cross-section properties according to EN 1993‑1‑3 (licenses for RSECTION and Effective Sections are required for the RSECTION cross-sections)
- Shear buckling check according to EN 1993‑1‑5 with consideration of transverse stiffeners
- Design of stainless steel components according to EN 1993‑1‑4
- Design of tension, compression, bending, shear, torsion, and combined internal forces
- Tension design with consideration of a reduced section area (for example, hole weakening)
- Automatic classification of cross-sections to check local buckling
- Internal forces from the calculation with Torsional Warping (7 DOF) are taken into account by means of the equivalent stress check (currently not yet for the design standard ADM 2020).
- Design of cross-sections of Class 4 with effective cross-section properties according to EN 1993‑1‑5 (licenses for RSECTION and Effective Sections are required for the RSECTION cross-sections)
- Shear buckling check with consideration of transverse stiffeners
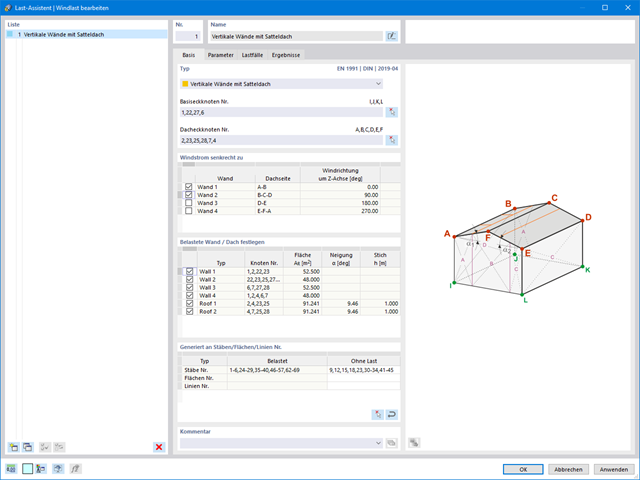
Wind loads are also not a problem in your design. You can automatically generate wind loads as member loads or area loads (RFEM) on the following structural components:
- Vertical walls
- Flat roofs
- Monopitch roofs
- Duopitch/troughed roofs
- Vertical walls with duopitch roof
- Vertical walls with flat/monopitch roof
The following standards are available to you:
-
 EN 1991-1-4 (including National Annexes)
 -
 ASCE 7
 -
 CTE DB-SE-AE
 -
 GB 50009
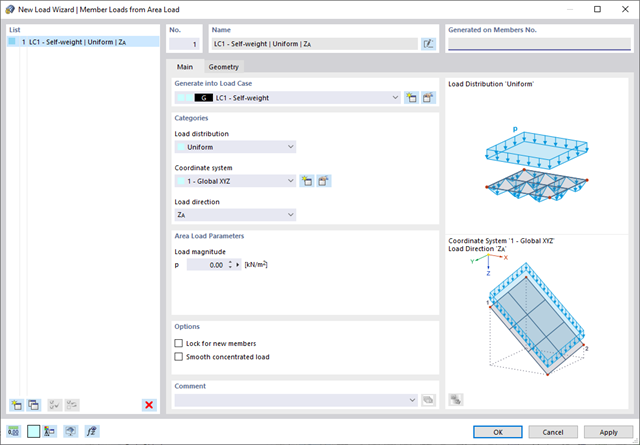
Use all types of loads without any difficulty. You can automatically convert the area loads into member loads or line loads (RFEM).
In the case of member loads from area loads, you have to define a plane via corner nodes or select cells in the graphic. Then the rest works by itself.
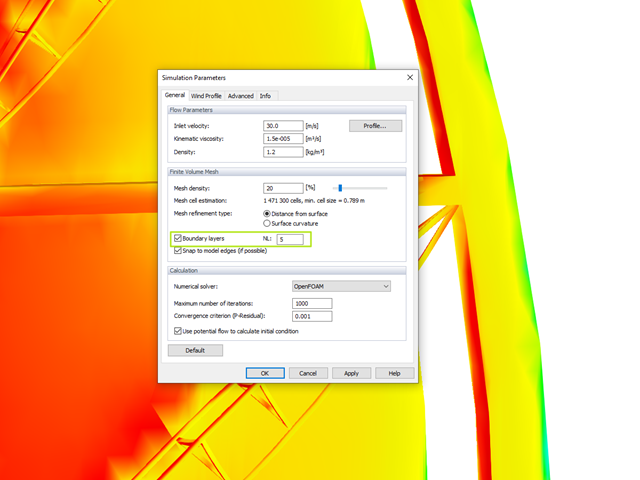
The meshing algorithm of RWIND Simulation uses the boundary layer option to mesh the area near the model surface with a voluminous layer mesh. The number of layers is controlled by a user-defined parameter.
This fine mesh in the area of the model surface helps to represent the wind velocity close to the surface.
- Footfall Analysis links with RFEM, using the model geometry from there, thus the user is not required to create a second model specifically for footfall analysis
- Allows the user to analyze any type of structure for footfall analysis, irrespective of the shape, material, or use
- Quick and accurate predictions of resonant and impulsive (transient) responses
- Cumulative measurement of vibration levels – VDV analysis
- Intuitive output enabling the engineer to advise improvements of critical areas in a cost-effective way
- Pass/fail limit check in accordance with BS 6472 and ISO 10137
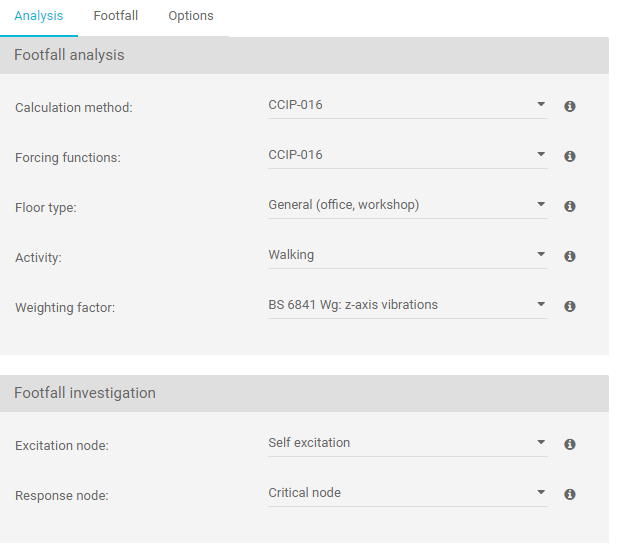
- Selection of excitation forces: CCIP-016, SCI P354, AISC DG11 for floors and stairs
- Frequency weighting curves (BS 6841)
- Quick investigation for full model or specific areas
- Vibration Dose Analysis (VDV)
- Adjusting the minimum and maximum walking frequencies as well as the walker’s weight
- User input damping values
- Varying the number of footfalls for resonant response, user input or software calculated
- Environmental response limit based on BS 6472 and ISO 10137