130 Wyniki
Wyświetl wyniki:
Sortuj według:
- Proponowane połączenie można zastosować do wszystkich wybranych węzłów w konstrukcji
- Położenie połączenia można zdefiniować w zakładce 'Główne' okna dialogowego rozszerzenia
- Obliczenia są przeprowadzane dla wszystkich połączeń w konstrukcji, a po zakończeniu obliczeń wyniki mogą być wyświetlane we wszystkich połączeniach
- W tabeli wyświetlane są wyniki dla poszczególnych połączeń, każde połączenie jest obliczane i może być zapisane osobno
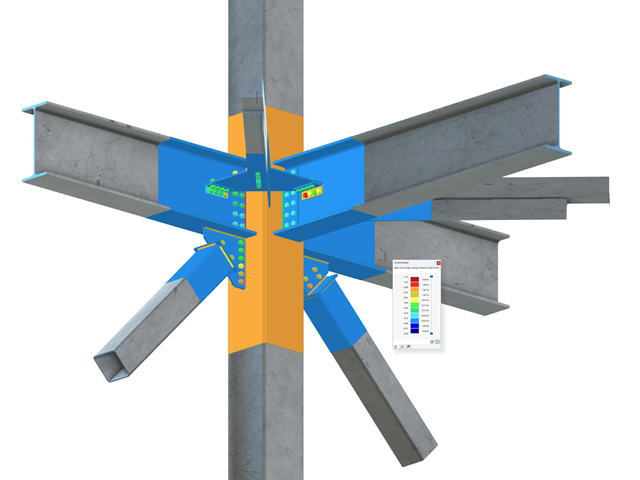
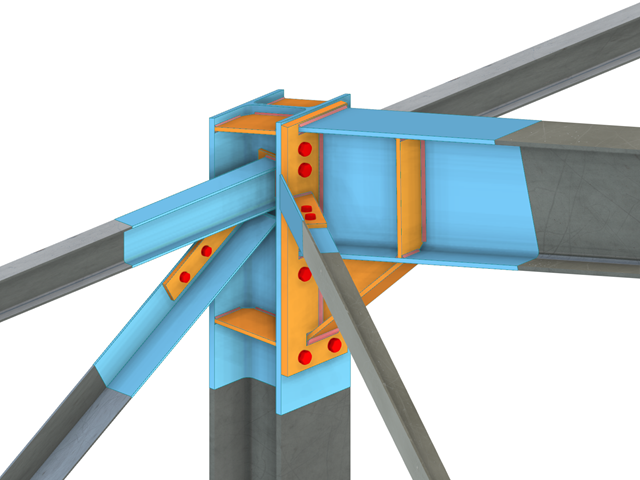
Złożone połączenie belek poziomych ze słupem oraz połączenie stężeń ukośnych
Model połączenia został zamodelowany przy użyciu około 50 komponentów. Model został stworzony na podstawie rzeczywistego przykładu wykorzystania w konstrukcji.
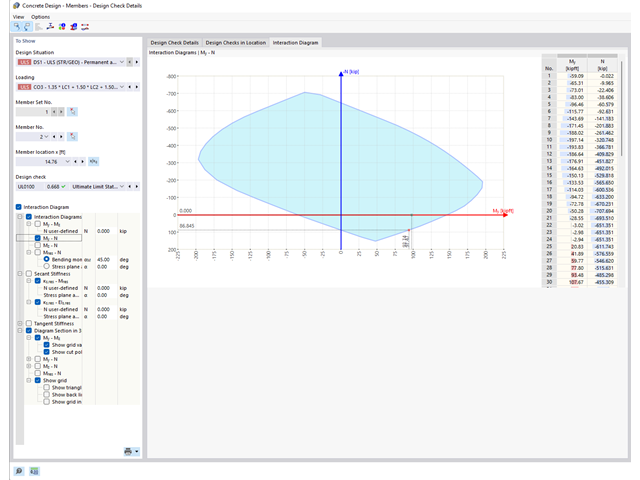
Czy wiesz, że wykresy interakcji moment-siła (wykresy MN) można wyświetlić również graficznie? Umożliwia to wyświetlenie nośności przekroju w przypadku interakcji momentu zginającego i siły osiowej. Oprócz wykresów interakcji związanych z osiami przekroju (wykres My-N i wykres Mz-N) można również wygenerować indywidualny wektor momentów w celu utworzenia wykresu interakcji Mres -N. Płaszczyznę przekroju wykresów MN można wyświetlić na wykresie interakcji 3D.Program wyświetla odpowiednie pary wartości stanu granicznego nośności w tabeli. Tabela jest dynamicznie powiązana z wykresem, dzięki czemu wybrany punkt graniczny jest również wyświetlany na wykresie.
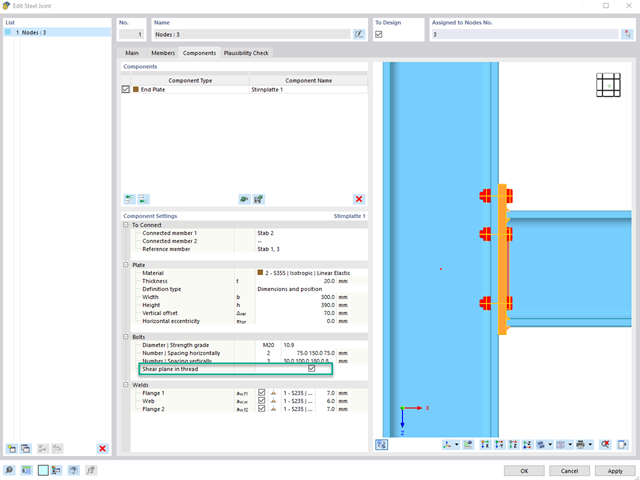
Aby określić nośność śrub na ścinanie, w rozszerzeniu Połączenia stalowe można określić, czy w połączeniu na ścinanie znajduje się trzpień czy gwint.
Przejdź do filmu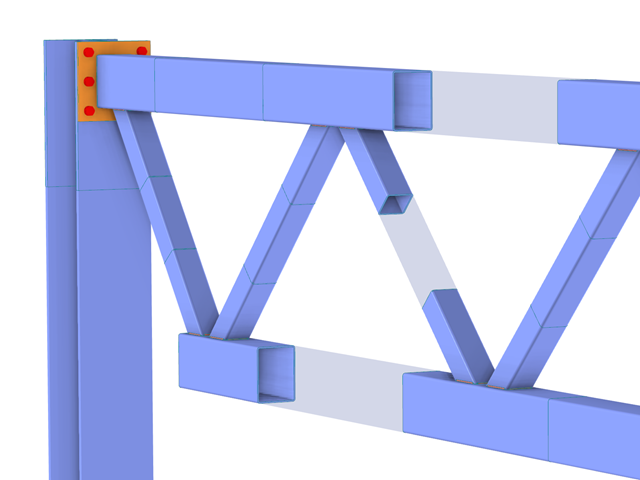
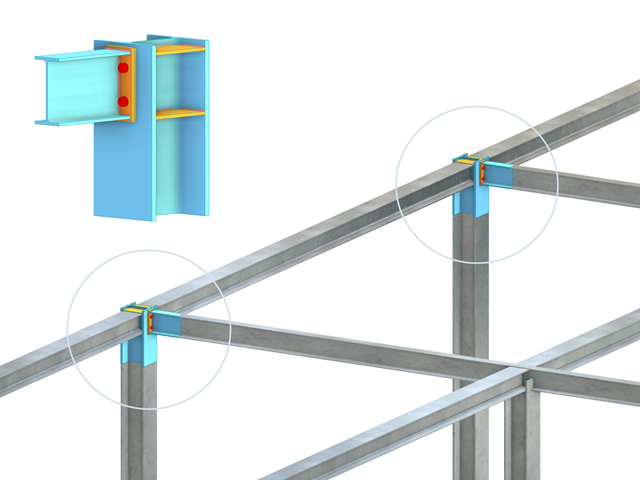
W przypadku przekrojów prostokątnych zwykle można uzyskać bezpośrednie połączenie za pomocą spoin. W ten sam sposób można je jednak połączyć z innymi przekrojami. Ponadto inne elementy, takie jak blachy czołowe, pomagają w łączeniu przekrojów prostokątnych z innymi elementami konstrukcyjnymi.
Stalowe połączenia śrubowe z blachami węzłowymi na konstrukcji zadaszenia.
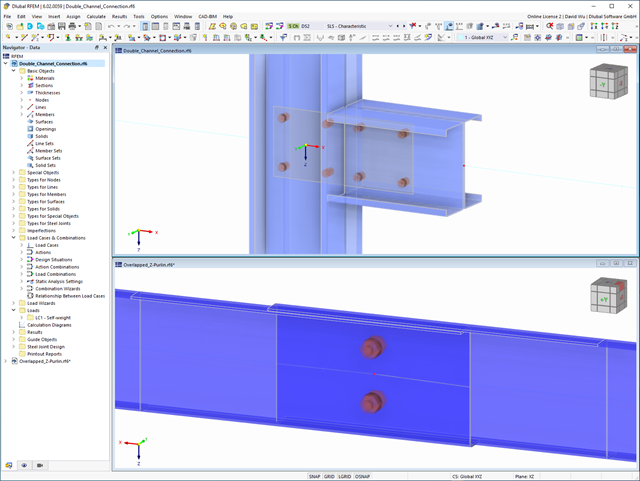
Pobierz model do analizy statyczno-wytrzymałościowej i otwórz go w programie RFEM 6, korzystając z rozszerzenia Połączenia stalowe.
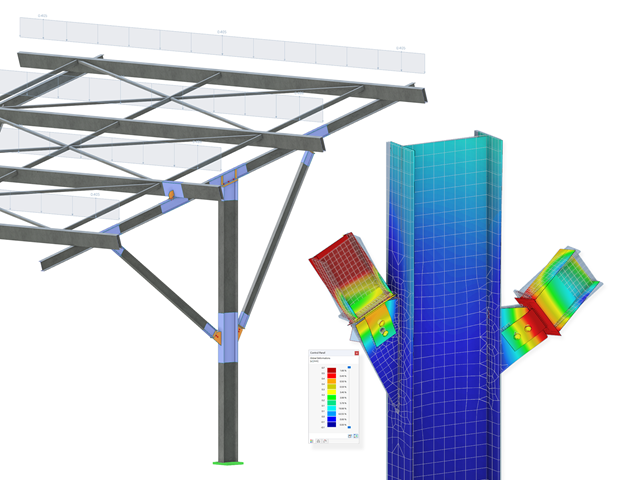
Wymiarowanie połączenia ramy o prętach zbieżnych i usztywnionych. Dla połączenia przeprowadzono analizę naprężeń i stateczności przy wyboczeniu. Aby wyświetlić wyniki dla wyboczenia, połączenie zostało przekształcone w osobny model.
Rozszerzenie Połączenia stalowe umożliwia wymiarowanie połączeń prętów o złożonych przekrojach. Ponadto można przeprowadzać obliczenia połączeń dla prawie wszystkich przekrojów cienkościennych z biblioteki programu RFEM.
Przejdź do filmuProgram wspiera Cię: Moduł określa siły w śrubach na podstawie modelu analitycznego ES i analizuje je automatycznie. Rozszerzenie przeprowadza obliczenia nośności śrub dla przypadków uszkodzeń, takich jak rozciąganie, ścinanie, docisk otworu i przebicie, zgodnie z normą i wyświetla w przejrzysty sposób wszystkie wymagane współczynniki.
Chcesz przeprowadzić wymiarowanie spoin? Spoiny są modelowane jako sprężysto-plastyczne elementy powierzchniowe, a ich naprężenia są odczytywane z modelu analitycznego ES. Kryterium plastyczności ma reprezentować zniszczenie zgodnie z AISC J2-4, J2-5 (wytrzymałość spoin) i J2-2 (wytrzymałość metalu podstawowego). Obliczenia można przeprowadzić z zastosowaniem częściowych współczynników bezpieczeństwa określonych w załączniku krajowym do normy EN 1993-1-8.
Płyty w połączeniu są wymiarowane w sposób plastyczny poprzez porównanie istniejącego odkształcenia plastycznego z dopuszczalnym odkształceniem plastycznym. Domyślne ustawienie wynosi 5% zgodnie z EN 1993-1-5, Załącznik C, ale można to zmienić według specyfikacji użytkownika, a także 5% dla AISC 360.
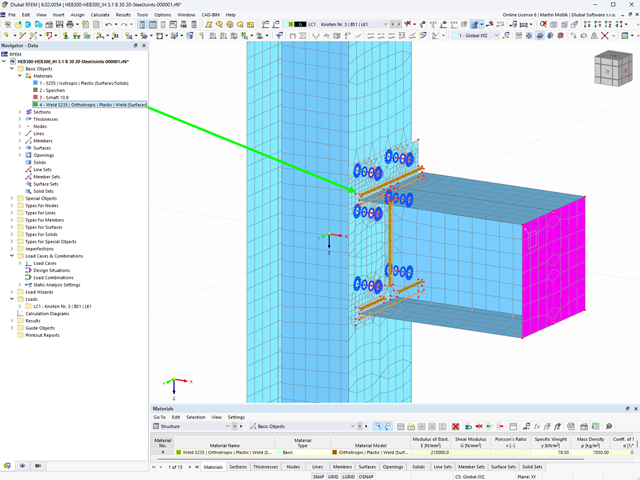
W tym przypadku projektowanie spoin staje się dziecinnie proste. Dzięki specjalnie opracowanemu modelowi materiałowemu „Ortotropowy | Plastyczny | Spoina (Powierzchnie)" można obliczyć wszystkie składowe naprężenia w sposób plastyczny. Naprężenie Tprostopadłe jest również rozpatrywane w sposób plastyczny.
Korzystanie z tego modelu materiałowego umożliwia realistyczne i ekonomiczne projektowanie spoin.
Film wyjaśniający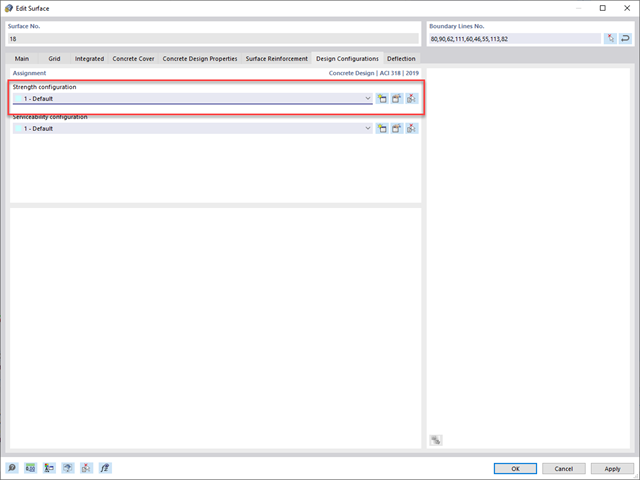
- 002469
- Ogólne informacje
- Projektowanie konstrukcji betonowych RFEM 6
- Projektowanie konstrukcji betonowych RSTAB 9
Pracujesz z elementami konstrukcyjnymi składającymi się z płyt? W takim przypadku należy przeprowadzić obliczenia na ścinanie z uwzględnieniem wymagań obliczania przebicia, na przykład zgodnie z 6.4, EN 1992-1-1. Oprócz płyt stropowych można w ten sposób wymiarować również płyty fundamentowe.
W konfiguracji stanu granicznego nośności dla wymiarowania betonu można zdefiniować parametry obliczeń przebicia dla wybranych węzłów.
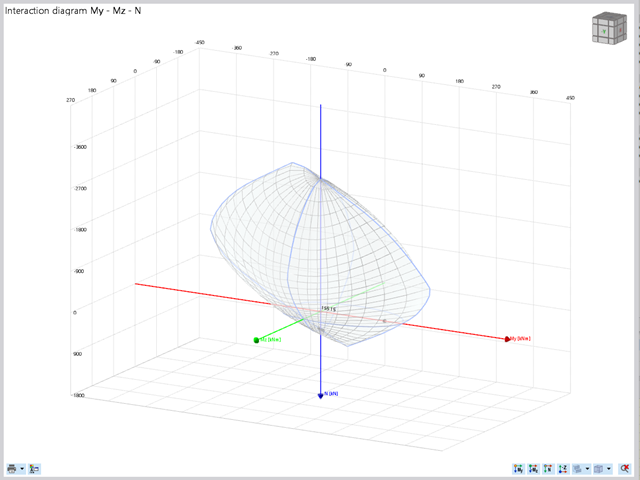
Projektowanie konstrukcji betonowych | Wykres interakcji My-Mz-N (3D) przekrojów z betonu zbrojonego
Na pytanie 'Ile można przewozić?' zazwyczaj odpowiada 'Tak'. Do graficznego przedstawiania stanu granicznego nośności przekrojów żelbetowych wymagany jest trójwymiarowy wykres interakcji momentu-momentu-siła osiowa. Oprogramowanie do analizy statyczno-wytrzymałościowej firmy Dlubal właśnie to oferuje.
Dzięki dodatkowemu wyświetleniu oddziaływania obciążenia można łatwo rozpoznać lub zwizualizować przekroczenie granicznej nośności przekroju żelbetowego. Ponieważ możesz kontrolować właściwości wykresu, możesz dostosować wygląd wykresu My-Mz-N do swoich potrzeb.
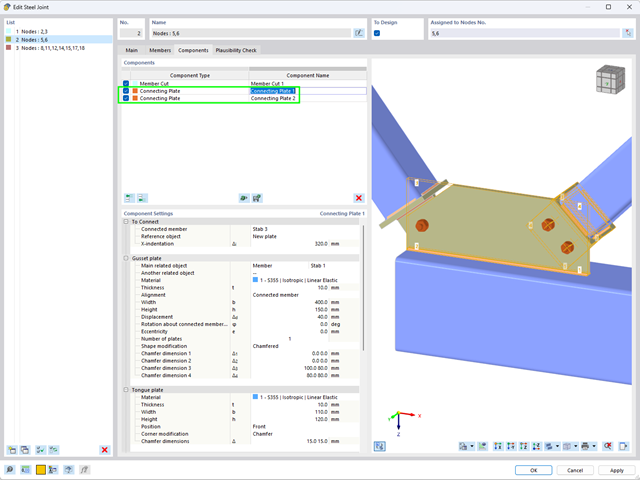
Za pomocą komponentu "Blacha łącząca" można automatycznie utworzyć nową blachę węzłową w rozszerzeniu Połączenia stalowe. Pozwala to na zaoszczędzenie oddzielnych komponentów, a pozostałe elementy, takie jak blacha czołowa i blacha nakładkowa, są automatycznie uwzględniane wraz z wymiarami.
Przejdź do filmu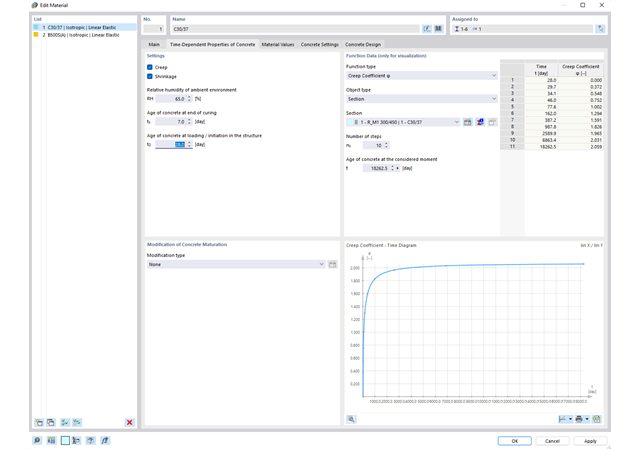
Właściwości betonu, zależne od czasu, takie jak pełzanie i skurcz, są bardzo ważne dla obliczeń. Można je zdefiniować bezpośrednio dla materiału w programie do analizy statyczno-wytrzymałościowej. W oknie dialogowym do wprowadzania danych wyświetlany jest przebieg czasowy funkcji pełzania lub skurczu. Można łatwo wybrać modyfikację zastosowanego wieku betonu, na przykład ze względu na obróbkę termiczną.
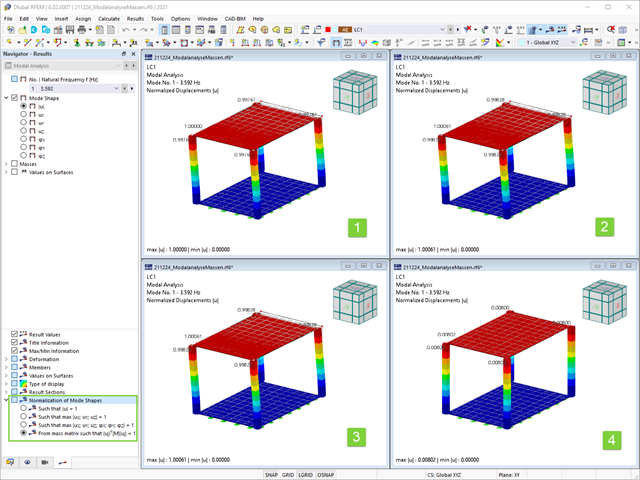
Jak już wiesz, po pomyślnym zakończeniu obliczeń wyniki przypadku obciążenia w Analizie modalnej są wyświetlane w programie. Die erste Eigenform ist für Sie also sofort grafisch oder animiert zu sehen. Dabei können Sie die Darstellung der Eigenformnormierung komfortabel anpassen. Erledigen Sie das am besten direkt im Ergebnisnavigator, wo Sie zur Visualisierung der Eigenformen eine von vier Optionen auswählen:
- Wert des Eigenformvektors uj auf 1 skalieren (berücksichtigt nur die Translationskomponenten)
- Auswahl der maximalen Translationskomponente des Eigenvektors und Einstellung auf 1
- Betrachtung der gesamten Eigenform (inklusive der Rotationskomponenten), Auswahl des Maximums und Einstellung auf 1
- Setzen der modalen Massen mi für jeden Eigenwert auf 1 kg
Ausführlichere Erläuterungen der Normierung der Eigenformen finden Sie hier: Instrukcja online .
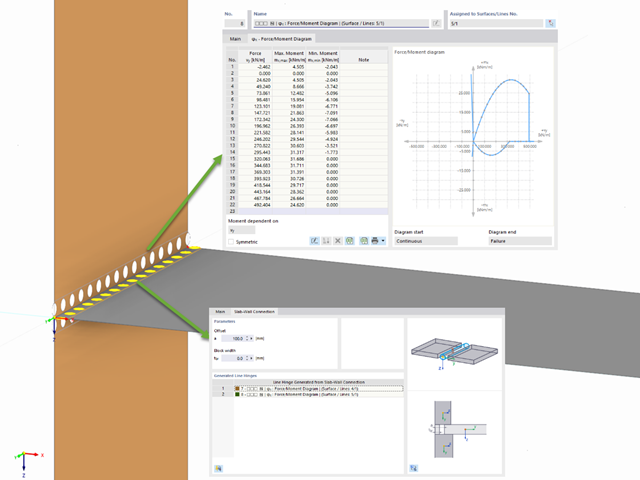
Program RFEM umożliwia wykorzystanie specjalnego przegubu liniowego do modelowania specjalnych właściwości połączenia między płytą żelbetową a ścianą murowaną. Ogranicza to przenoszone siły połączenia w zależności od określonej geometrii. Zgadnij dobrze: Oznacza to, że materiał nie może być przeciążony.
Program tworzy wykresy interakcji, które są stosowane automatycznie. Reprezentują one różne sytuacje geometryczne i można je wykorzystać do określenia prawidłowej sztywności.
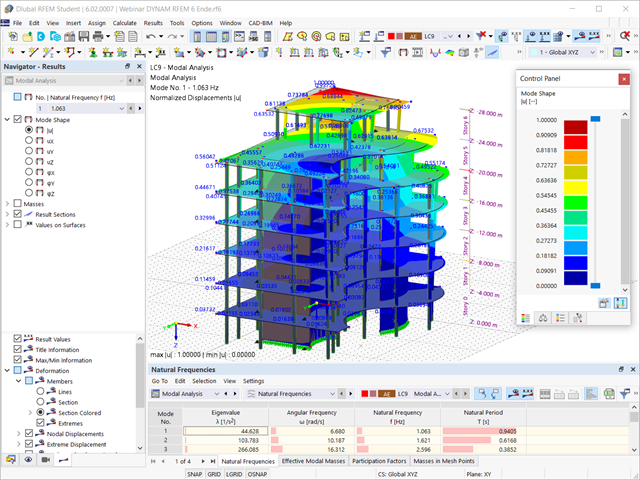
Czy obliczenia się zakończyły? Wyniki analizy modalnej są wówczas dostępne zarówno w formie graficznej, jak i tabelarycznej. Wyświetl tabele wyników dla przypadku obciążenia lub przypadków obciążeń analizy modalnej. Dzięki temu na pierwszy rzut oka można zobaczyć wartości własne, częstotliwości kątowe, częstotliwości i okresy drgań własnych konstrukcji. W przejrzysty sposób wyświetlane są również efektywne masy modalne, modalne współczynniki masy i współczynniki udziału.
.png?mw=640&hash=5a991f211d984ac624978f514e70c53da263e5d9)
W zależności od siły osiowej N, można wygenerować linię krzywizny momentu dla dowolnego wektora momentu. Program pokazuje również pary wartości wyświetlanego wykresu w tabeli. Ponadto można aktywować jako dodatkowy wykres sieczny i sztywność styczną przekroju żelbetowego, należące do wykresu krzywizny momentu.
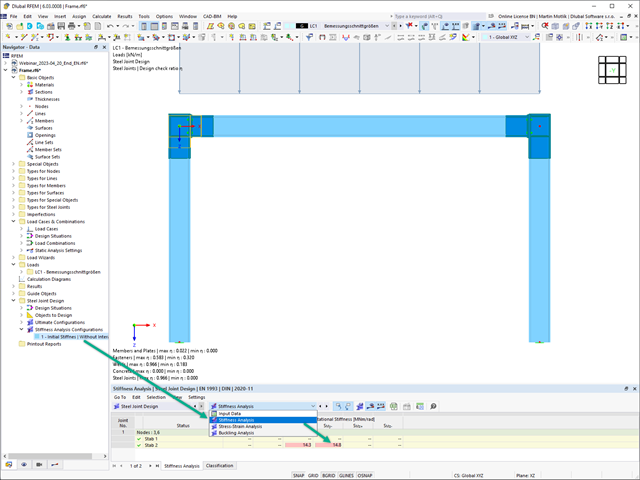
Sztywność początkowa Sj,ini jest parametrem decydującym o ocenie, czy połączenie można scharakteryzować jako sztywne, niesztywne czy przegubowe.
W rozszerzeniu „Połączenia stalowe” można obliczyć początkowe sztywności Sj,ini zgodnie z Eurokodem (EN 1993-1-8 sekcja 5.2.2) i AISC (AISC 360-16 Cl. E3.4) w odniesieniu do sił wewnętrznych N, My i/lub Mz.
Opcjonalne automatyczne przenoszenie sztywności początkowych umożliwia bezpośrednie przenoszenie sztywności przegubowych na końcach prętów w programie RFEM. Następnie cała konstrukcja jest ponownie obliczana, a wynikające z niej siły wewnętrzne są automatycznie uwzględniane jako obciążenia w obliczeniach i wymiarowaniu modeli połączeń.
Ten zautomatyzowany proces iteracji eliminuje konieczność ręcznego eksportu i importu danych, zmniejszając ilość pracy i minimalizując potencjalne źródła błędów.
Film wyjaśniający: Obliczanie sztywności początkowej Sj,ini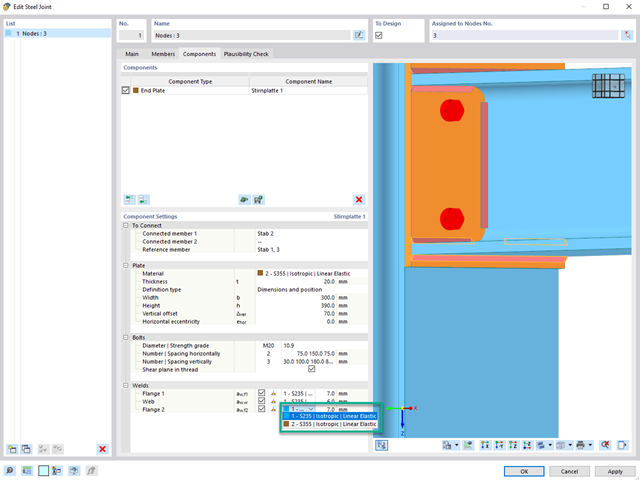
W przypadku spoiny łączącej dwie płyty z różnych materiałów, można teraz wybrać z pola rozwijanego, który z obu materiałów ma zostać użyty do utworzenia spoiny.
Przejdź do filmu