


Introduction
When designing reinforced concrete members according to the ACI 318-19 [1], the moment interaction diagram is an essential tool. These diagrams represent the relationship between the bending moment and axial force at any given point along a reinforced concrete member. Valuable information is shown visually such as strength and how the concrete behaves under different loading conditions.
Explanation
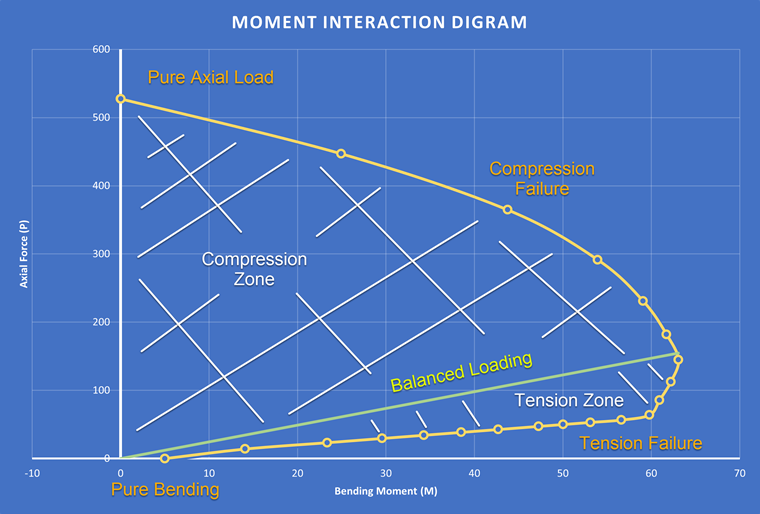
The moment interaction diagram is used to determine the maximum moment and axial force a member can resist, which is useful in calculating the ultimate strength. Generating a moment interaction diagram requires calculating the maximum axial force and moment. Then, theses points are plotted on an x-y graph. The y-axis represents the axial force, and the x-axis represents the bending moment. The interaction between these two forces is shown through a line/curve which represents the maximum resistance of the reinforced section. Any point on the curve represents a unique combination of bending moment and axial force that the reinforced section can resist. This curve is then further divided into regions based on failure points. For example, the upper region represents pure bending failure, and the lower region represents pure axial failure. This is shown in Image 01.
RFEM 6 Integration
RFEM 6, with the Concrete Design Add-on, can analyze and design reinforced concrete structures. The add-on can create a moment interaction diagram automatically for any column or beam. The maximum moment and axial force a member can resist is calculated in the static analysis which is automatically considered in the Concreted Design add-on. Then, once the option is checked, a moment interaction diagram is generated based on properties such as section size and reinforcement layout.
Analytical Verification
A 12" x 20" rectangular reinforced concrete column is modeled and shown in Image 02.
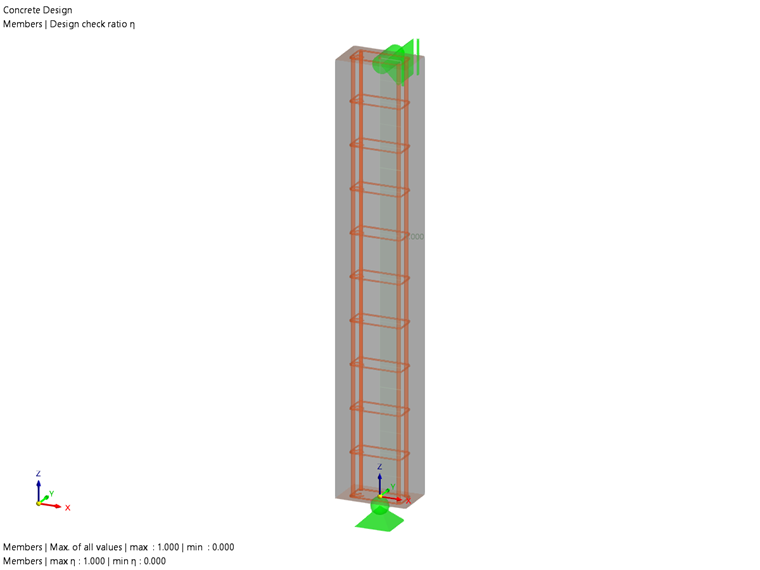
The 10 foot concrete column has a compressive strength (f'c) equal to 4,000 psi. Four #9, Grade 60 steel bars are placed in the corners for longitudinal reinforcement. #4 bars are selected for shear reinforcement. The concrete cover is 2.5 inches.
For this section, a 4-point linear interaction diagram will be analytically calculated and verified with RFEM 6.
The depths of the tension and compression steel are calculated as followed:
d = 20" - 2.5" = 17.5"
d' = 2.5"
Point A is first. It is assumed the member is experiencing pure compression and the section has reached the strain limit (εcu) of 0.003. Below, the compressive strength for the steel and concrete is summed. The pure compression point, based on the stress-strain diagram, is calculated below:
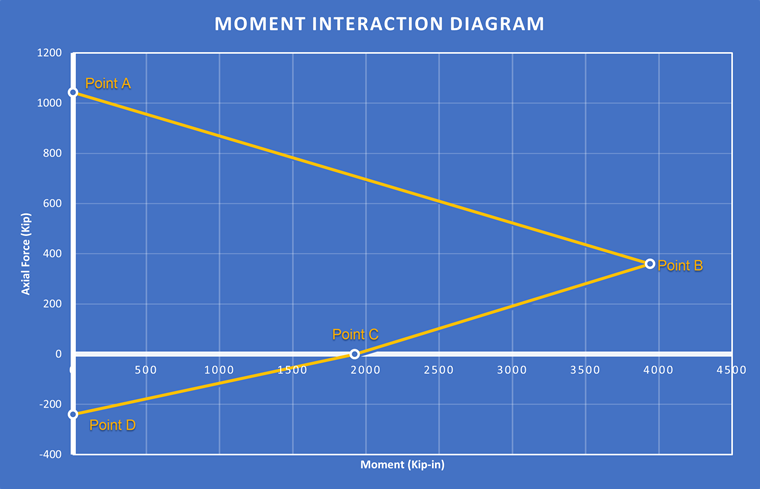
The axial force (PN,A) equals 1042.4 kips.
Since only pure compression is present, the moment (MN,A) is equal to 0 kip-in.
Point B is next. This is the "balance" point where we assume the steel is yielding. This needs to be checked. "Similar triangles" is used to calculate the neutral axis or length of the compression block (c). For reference, c for Point A equaled 20 inches because the entire section was in compression.
c equals 10.36 inches. Now that c is known, the strain of the steel in compression (ε's) is calculated and compared to the yield strain of Grade 60 steel.
(ε's) equals 2.27x10⁻³ which is greater than 2.07x10⁻³. So the assumption was correct. The axial strength at this point, based on the stress diagram, is calculated:
PN,B equals 359 kips.
The moment MN,B is calculated and summed about the neutral axis:
MN,B equals 3940.23 kip-in.
Point C is now calculated where the axial force PN,C is equal to 0. The section is assumed to be doubly reinforced, however, the compression steel is neglected. The axial force is equal to 0 kips and moment is calculated as follows:
MN,C equals 1923.53 kip-in.
Point D is last where MN,D is equal to 0 kips and only pure axial force occurs.
PN,D is equal to 240 kips.
These points are plotted, thus, creating a linear moment interaction diagram. This is shown in the Image 02 below:
RFEM 6 Verification
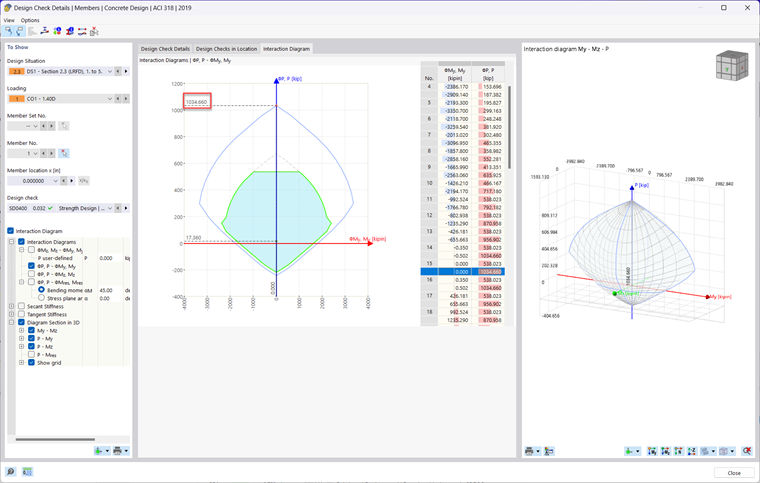
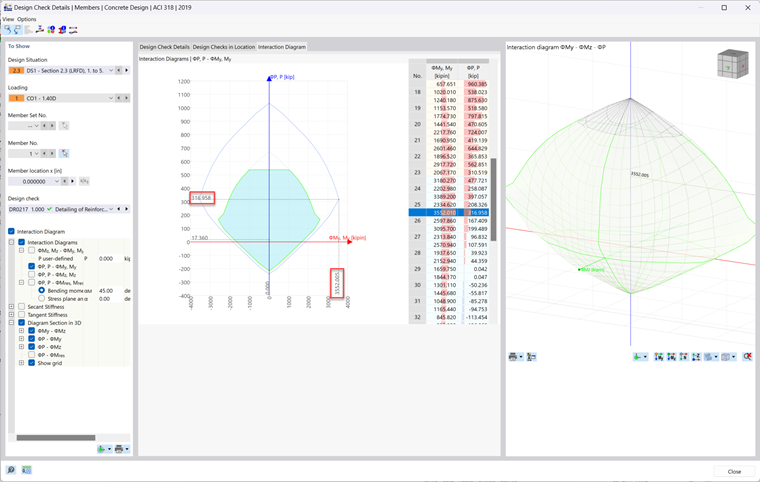
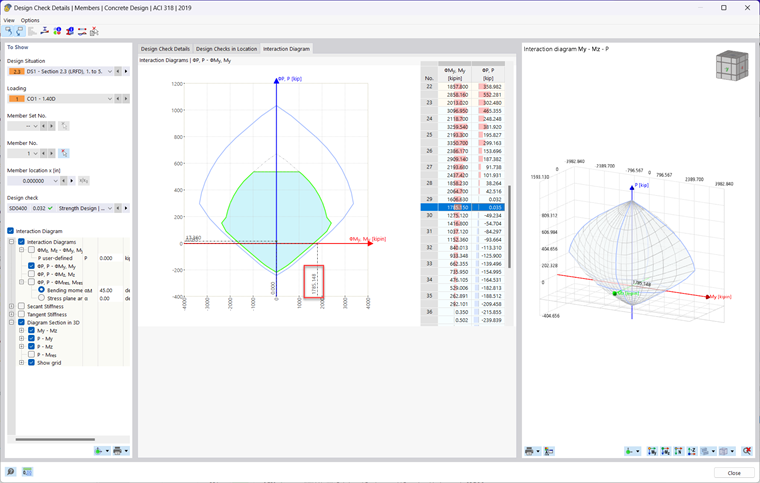
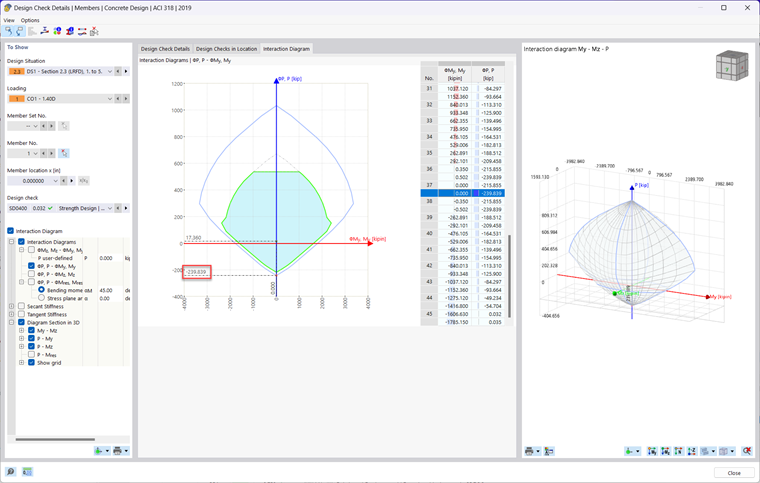
To view the moment interaction diagram generated by the Concrete Design add-on in RFEM 6, simply run the design results within the table. Then, click on the Design Details button in the table or double-click on any design check. Next, check on the Interaction Diagram checkbox. A new tab will then appear at the top where you can view the 2D and 3D moment interaction diagram of the member being designed.
The member was taken from the analytically verified example above and modeled in RFEM 6. The section, materials, and rebar layout was replicated. Designed is done using the Concrete Design Add-on according to the ACI 318-19 [1] standard. The member rendering is shown in Image 03 and the results are compared and verified below. Point A through D is shown in Images 4 through 8 with a verification ratio comparing the analytical with the RFEM 6 result.
Note: RFEM 6 assumes a parabolic stress diagram whereas the analytical example assumes a rectangular stress diagram. The difference between the analytical moment diagram and the RFEM 6 moment diagram lies in the assumptions made regarding the behavior of the materials and the resulting distribution of moments. The analytical stress diagram assumes a linear behavior for the concrete, while the RFEM 6 stress diagram considers a non-linear stress distribution in the concrete. RFEM 6's stress diagram provides a more accurate representation of the section's behavior. This leads to some deviation in results when comparing the analytical example with the RFEM 6 results which can be seen below.
Point A Ratio:
PN,A = 1.007
MN,A = 1.000
Point B Ratio:
PN,B = 1.133
MN,B = 1.109
Point C Ratio:
PN,C = 1.000
MN,C = 1.043
Point D Ratio:
PN,D = 1.001
MN,D = 1.000
Conclusion
The moment interaction diagram is an essential tool for engineers designing reinforced concrete. These diagrams provide important details on strength, stability, and behavior of the concrete under various loading conditions. RFEM 6 is a valuable tool that can be used to generate moment interaction diagrams and view them in real-time.