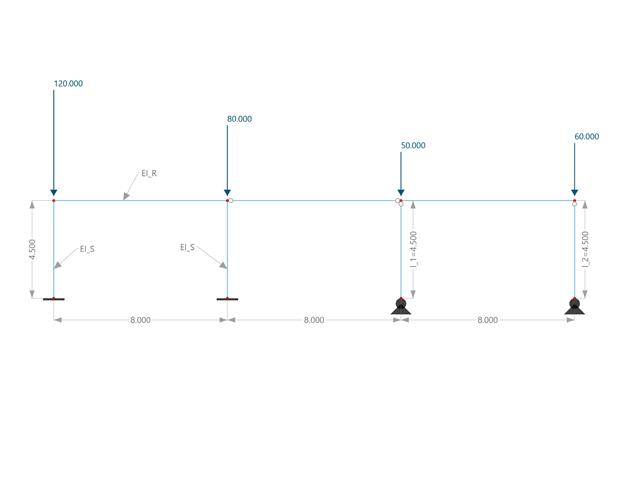
This example compares the effective lengths and critical load factor, which can be calculated in RFEM 6 using the Structure Stability add-on, with a manual calculation. The structural system is a rigid frame with two additional hinged columns. This column is loaded by vertical concentrated loads.
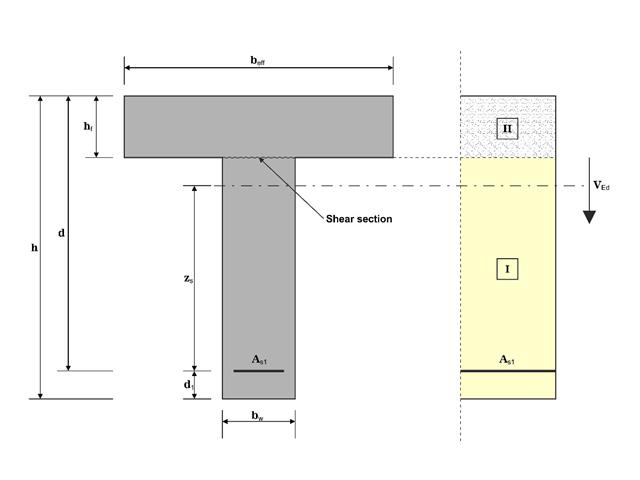
In this example, the shear at the interface between concrete cast at different times and the corresponding reinforcement are determined according to DIN EN 1992-1-1. The obtained results with RFEM 6 will be compared to the hand calculation below.
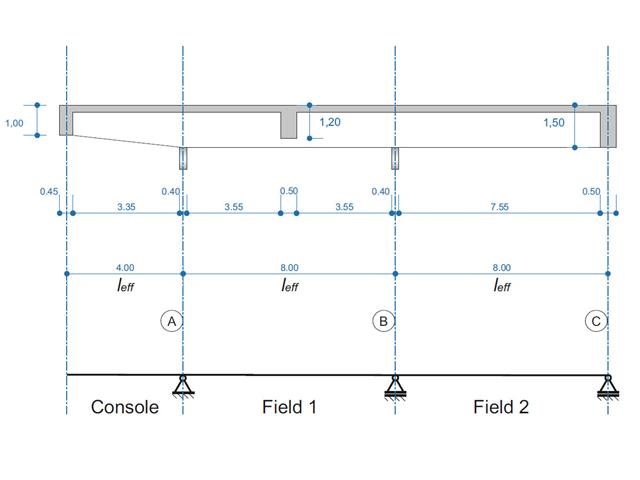
A reinforced concrete beam is designed as a two-span beam with a cantilever. The cross-section varies along the length of the cantilever (tapered cross-section). The internal forces, the required longitudinal and shear reinforcement for the ultimate limit state are calculated.
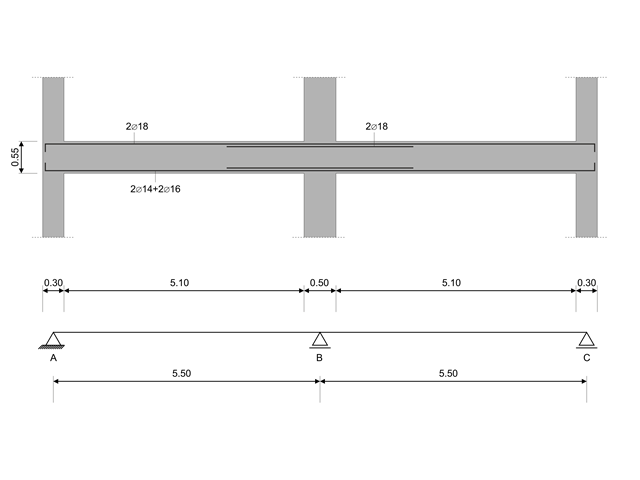
In this verification example, the capacity design values of shear forces on beams are calculated in accordance with EN 1998-1, 5.4.2.2 and 5.5.2.1 as well as the capacity design values of columns in flexure in accordance with 5.2.3.3(2). The system consists of a two span reinforced concrete beam with a span length of 5.50m. The beam is part of a frame system. The results obtained are compared with those in [1].
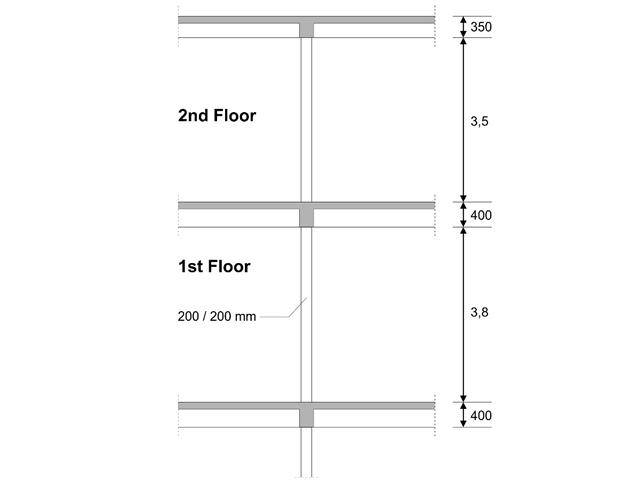
An inner column in the first floor of a three-story building is designed. The column is monolithic connected with the top and bottom beams. The fire design simplified method A for columns according to EC2-1-2 is than proofed and the results compared to [1].
In the current validation example, we investigate wind pressure coefficient (Cp) for both main structural members (Cp,ave) and secondary structural members such as cladding or façade systems (Cp,local) based on NBC 2020 [1] and Japanese Wind Tunnel Data Base for low-rise building with 45 degree slope. The recommended setting for three-dimensional flat roof with sharp eaves will be described in the next part.
In the current validation example, we investigate wind pressure value for both general structural design (Cp,10) and local structural design such as cladding or façade systems (Cp,1) based on EN 1991-1-4 flat roof example [1] and Japanese Wind Tunnel Data Base . The recommended setting for three-dimensional flat roof with sharp eaves will be described in the next part.
In the current validation example, we investigate wind pressure coefficient (Cp) of flat roof and walls with ASCE7-22 [1]. In the section 28.3 (Wind loads - main wind force resisting system) and Figure 28.3-1 (load case 1), there is a table which shows Cp value for different roof angle.
The Architectural Institute of Japan (AIJ) has presented a number of well-known benchmark scenarios of wind simulation.
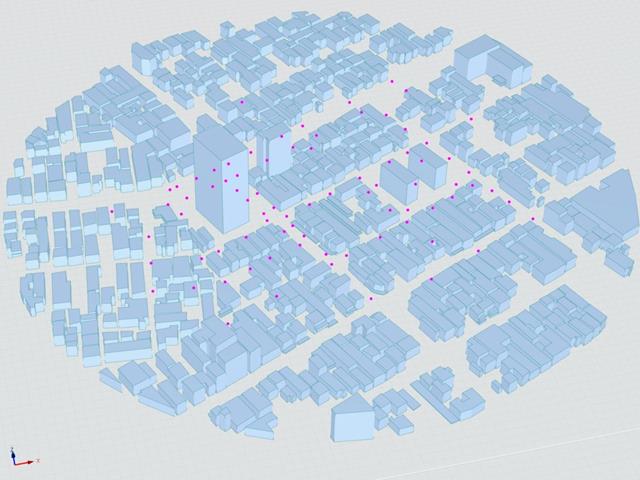
The following article deals with "Case E - Building Complex in Actual Urban Area with Dense Concentration of Low-Rise Buildings in Niigata City".
In the following, the described scenario is simulated in RWIND& 2 and the results are compared with the simulated and experimental results by AIJ.
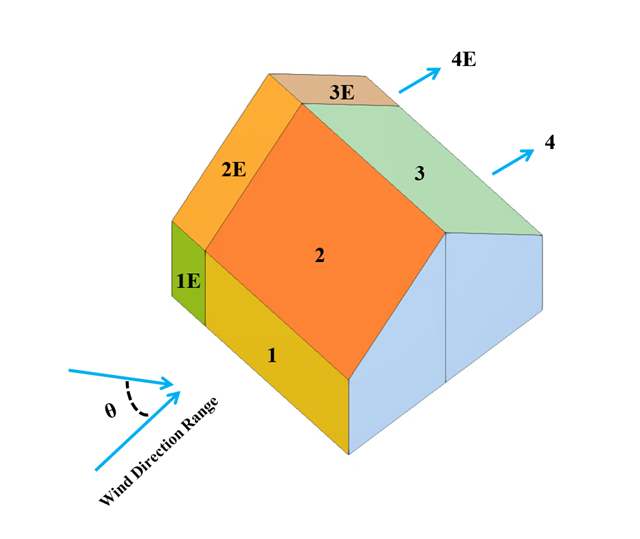
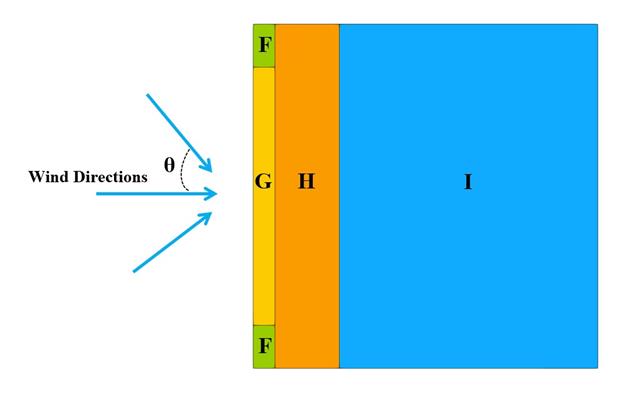
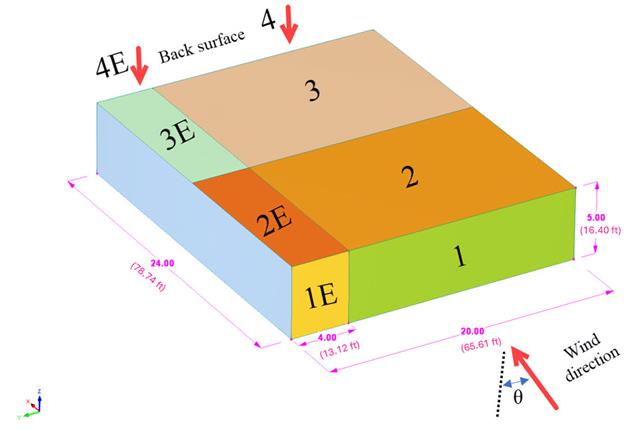
In the current validation example, we investigate wind pressure value for both general structural designs (Cp,10) and cladding or façade design (Cp,1) of rectangular plan buildings with EN 1991-1-4 [1]. There are three dimensional cases that we will explain more about if in the next part.
Das Architectural Institute of Japan (AIJ) hat eine Reihe an bekannten Benchmark-Szenarien für Windsimulation vorgestellt.
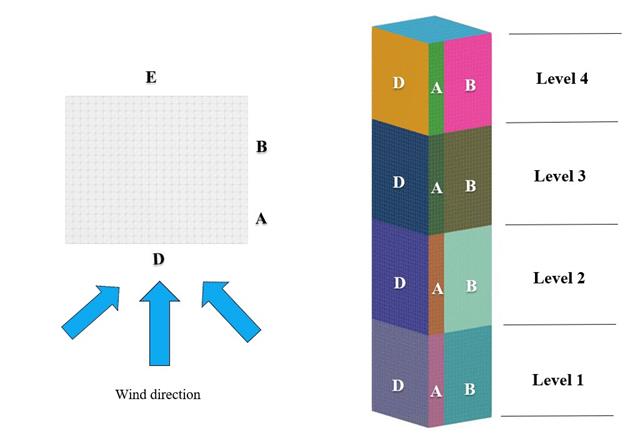
Der Nachfolgende Beitrag dreht sich dabei um den "Case A - high-rise building with a 2:1:1 shape".
Im Folgenden wird das beschriebene Szenario in RWIND2 nachgebildet und die Ergebnisse mit den simulierten und der experimentellen Resultate des AIJ verglichen.
The Architectural Institute of Japan (AIJ) has presented a number of well-known benchmark scenarios of wind simulation.
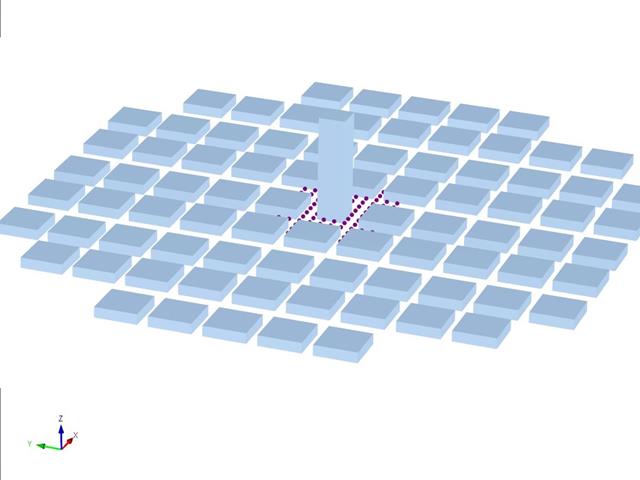
The following article deals with "Case D - High-Rise Building Among City Blocks".
In the following, the described scenario is simulated in RWIND 2 and the results are compared with the simulated and experimental results by the AIJ.
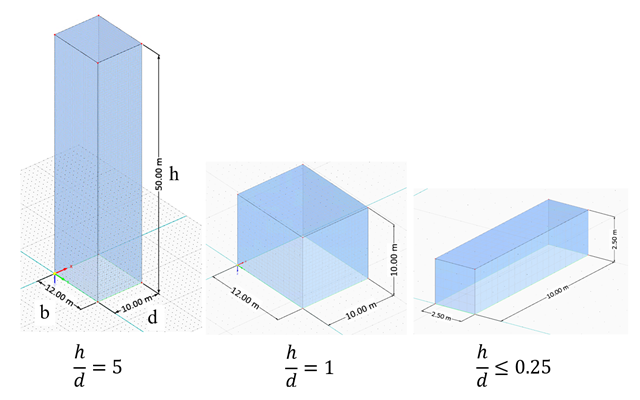
In the current validation example, we investigate wind force coefficient (Cf) of cube shapes with EN 1991-1-4 [1]. There are three dimensional cases that we will explain more about if in the next part.
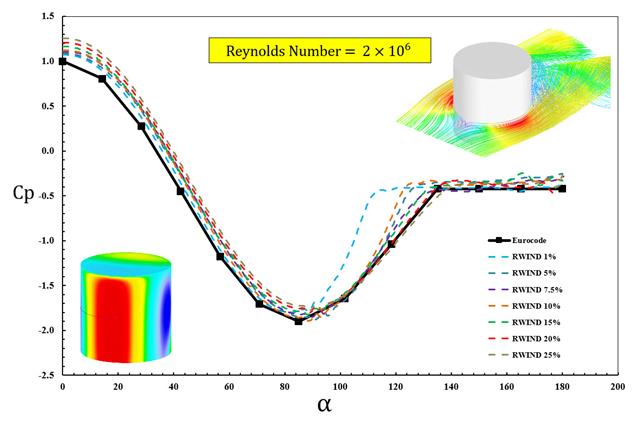
The available standards, such as EN 1991-1-4 [1], ASCE/SEI 7-16, and NBC 2015 presented wind load parameters such as wind pressure coefficient (Cp) for basic shapes. The important point is how to calculate wind load parameters faster and more accurately rather than working on time-consuming as well as sometimes complicated formulas in standards.
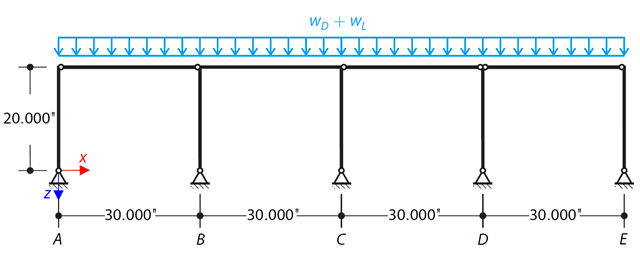
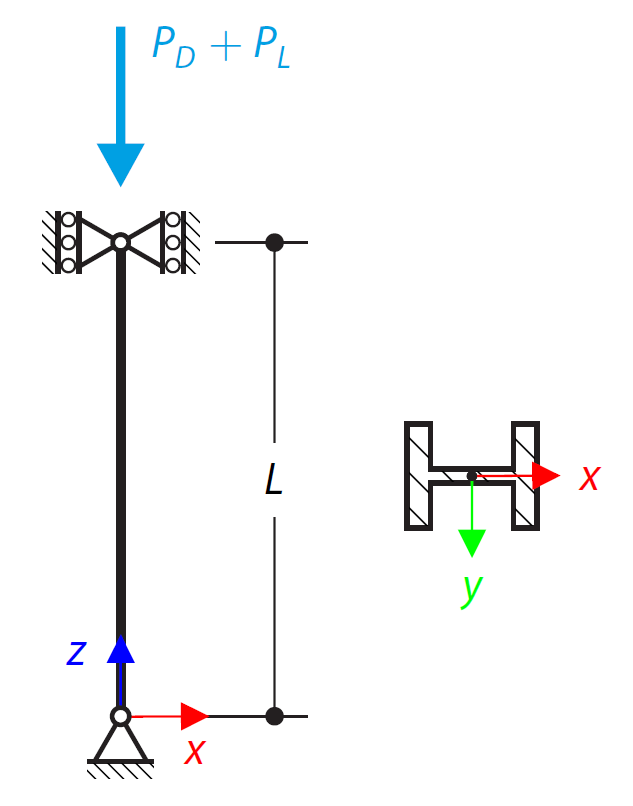
Determine the required strengths and effective length factors for the ASTM A992 material columns in the moment frame shown in Figure 1 for the maximum gravity load combination, using LRFD and ASD.
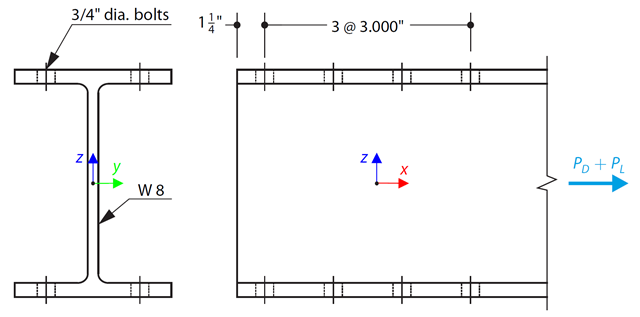
An ASTM A992 W-shaped member is selected to carry a dead load of 30.000 kips and a live load of 90.000 kips in tension. Verify the member strength using both LRFD and ASD.
An ASTM A992 14×132 W-shaped column is loaded with the given axial compression forces. The column is pinned top and bottom in both axes. Determine whether the column is adequate to support the loading shown in Figure 1 based on LRFD and ASD.
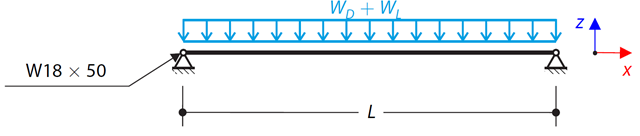
Consider an ASTM A992 W 18x50 beam forspan and uniform dead and live loads as shown in Figure 1. The member is limited to a maximum nominal depth of 18 inches. The live load deflection is limited to L/360. The beam is simply supported and continuously braced. Verify the available flexural strength of the selected beam, based on LRFD and ASD.
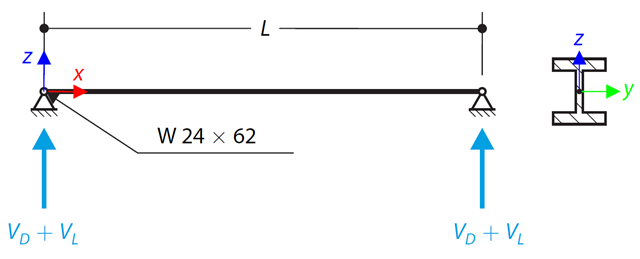
An ASTM A992 W 24×62 beam with end shears of 48.000 and 145.000 kips from the dead and live loads, respectively, is shown in Figure 1. Verify the available shear strength of the selected beam, based on LRFD and ASD.
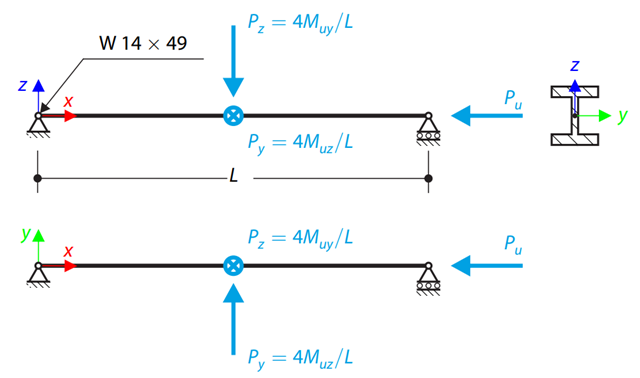
Using AISC Manual tables, determine the available compressive and flexural strengths and whether the ASTM A992 W14x99 beam has sufficient available strength to support the axial forces and moments shown in Figure 1, obtained from a second-order analysis that includes P-𝛿 effects.
Verify that a beam of different cross-sections made of Alloy 6061-T6 is adequate for the required load, in accordance with the 2020 Aluminum Design Manual.
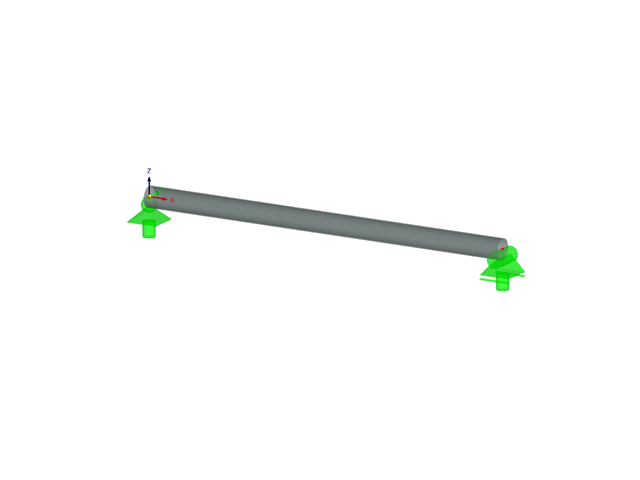
Determine the allowable axial compressive strength of a pinned 8-foot-long beam of various cross-sections made of Alloy 6061-T6 and laterally restrained to prevent buckling about its weak axis in accordance with the 2020 Aluminum Design Manual.
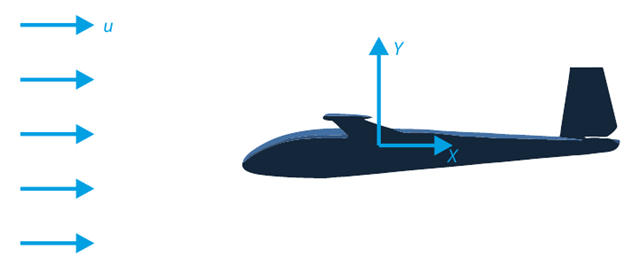
The goal of this verification example is to analyze the fluid flow around the glider. The task is to determine the drag coefficient and the lift coefficient with respect to the angle of attack. These coefficients can also be drawn into the graph of the drag polar. The limit angle for laminar fluid flow around the wing profile can also be determined from the velocity field. The available 3D CAD model (STL file) is used in RWIND 2.
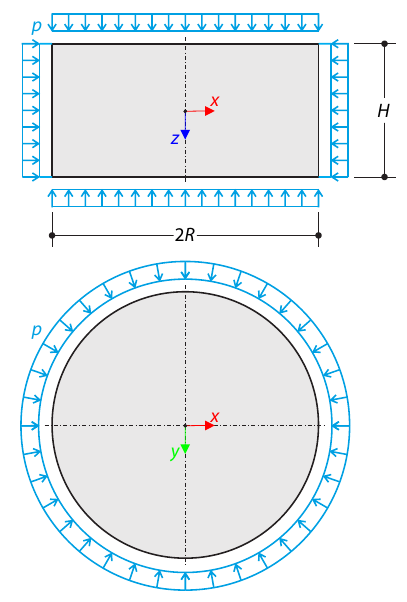
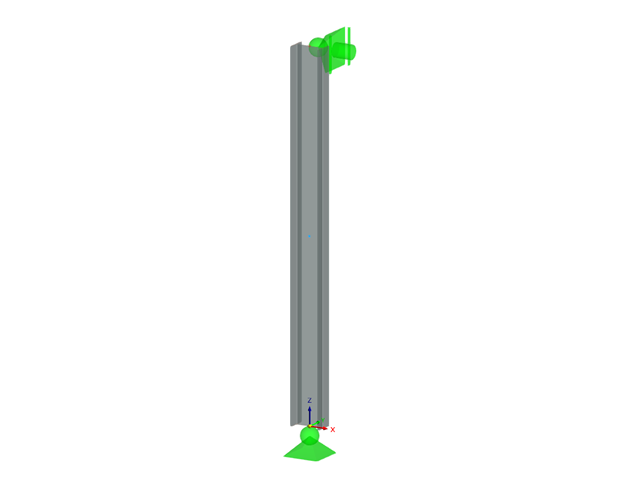
A cylinder made of elasto-plastic soil is subjected to triaxial test conditions. Neglecting the self-weight, the goal is to determine the limit vertical stress for shear stress failure. An initial hydrostatic stress of 100 kPa is considered.
The verification example describes wind loads in several wind directions on a model of a group of buildings. The model consists of eight cubes. The velocity fields obtained by the RWIND simulation are compared with the measured values from the experiment. The experimental data are measured using a thermistor anemometer in the wind tunnel.
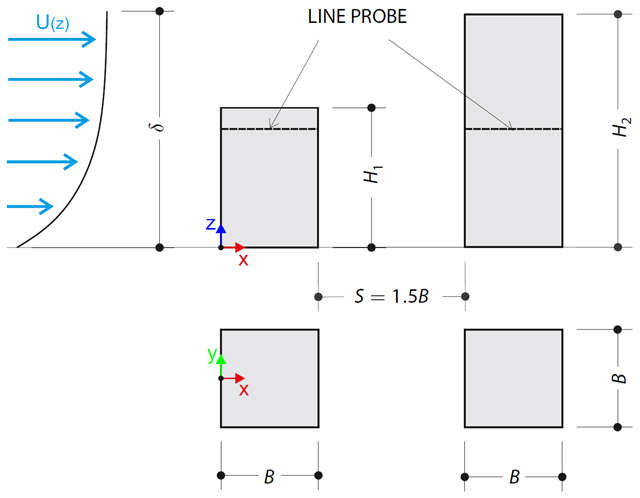
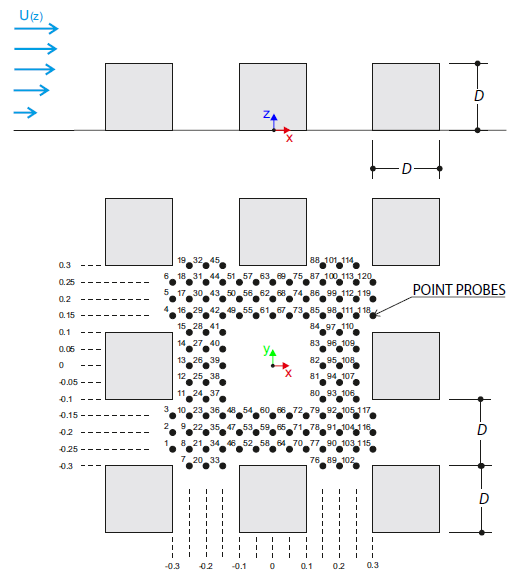
The verification example describes pressure loads on the walls of buildings in tandem arrangement located at ground level. The buildings are simplified to rectangular objects and scaled down while maintaining the elevation ratios. The pressure distribution on the walls of the model of a medium-high building was conducted by an experiment. The chosen results (pressure coefficient Cp) are compared with the measured values.
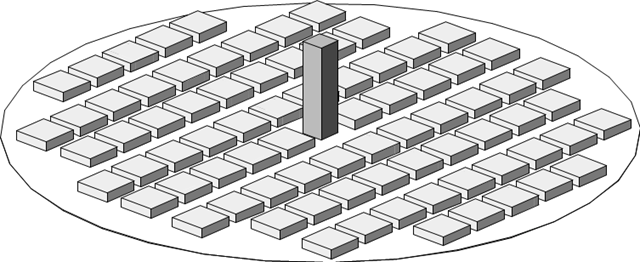
The verification example describes the steady-state flow around a high-rise building in city blocks (scaled model). The example is given by the Architectural Institute of Japan (AIJ). The chosen results (velocity magnitude) are compared with the measured values.
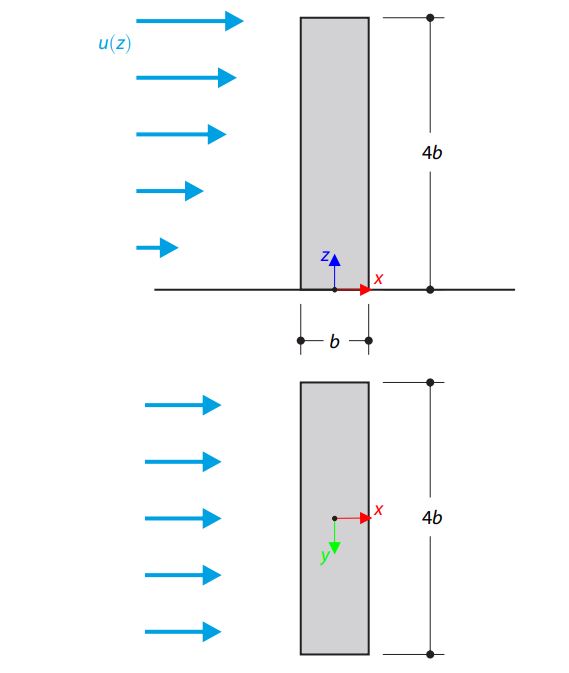
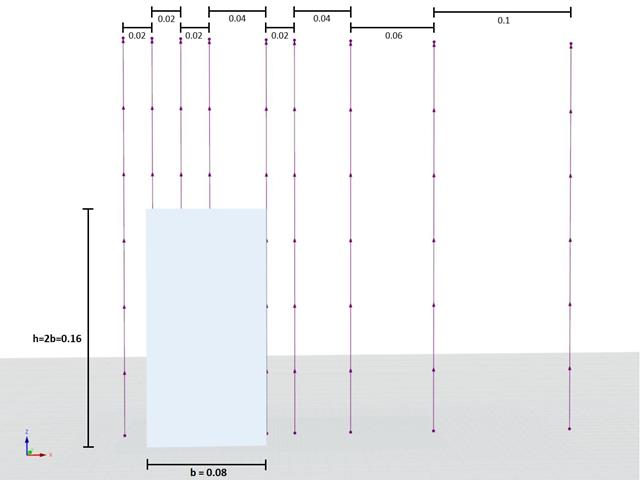
The verification example describes the steady-state flow around an isolated building (scaled model).The example is given by the Architectural Institute of Japan (AIJ). The chosen results (velocity magnitude) are compared with the measured values.
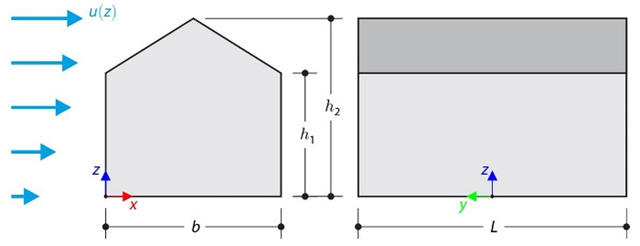
This verification example compares wind load calculations on a duopitch roof building using the ASCE 7-16 standard and using CFD simulation in RWIND Simulation. The building is defined according to the sketch and the inflow velocity profile taken from the ASCE 7-16 standard.
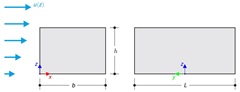
This verification example compares wind load calculations on a flat roof building using the ASCE 7-16 standard and using CFD simulation in RWIND Simulation. The building is defined according to the sketch and the inflow velocity profile taken from the ASCE 7-16 standard.