12 Results
View Results:
Sort by:
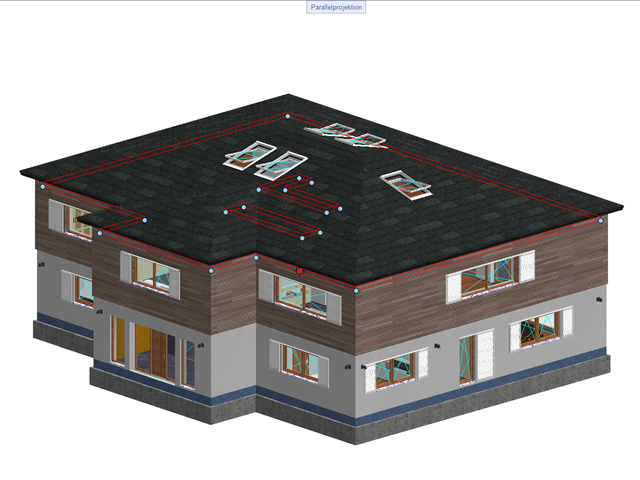
The data exchange between RFEM 6 and Allplan can be done using various file formats. This article describes the data exchange of a determined surface reinforcement using the ASF interface. This allows you to display the RFEM reinforcement values as level curves or colored reinforcement images in Allplan.
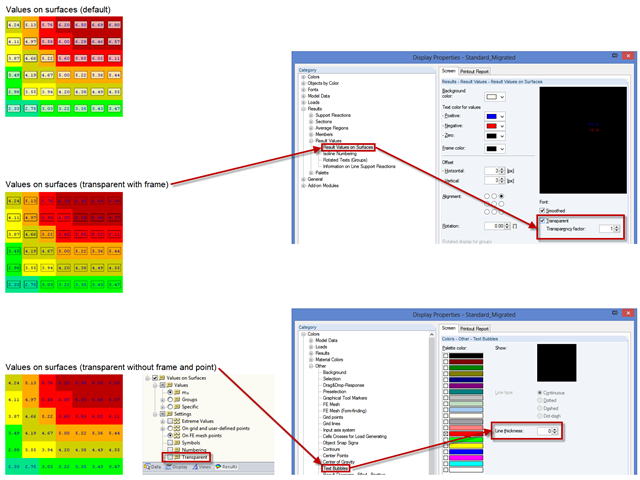
You can make various settings in order to achieve a clearly‑arranged display of the result values. For example, some users may not want the white background in text bubbles. You can adjust the background in "Display Properties" using the Transparent and Background color option.
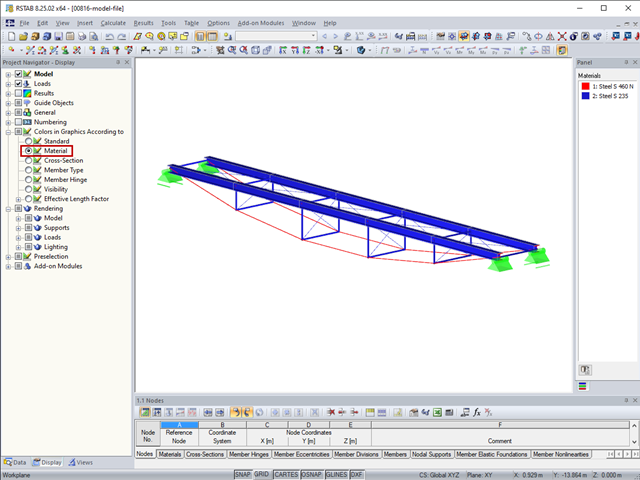
In RFEM and RSTAB, you can visually check or display the materials used for members in the wireframe and solid models.
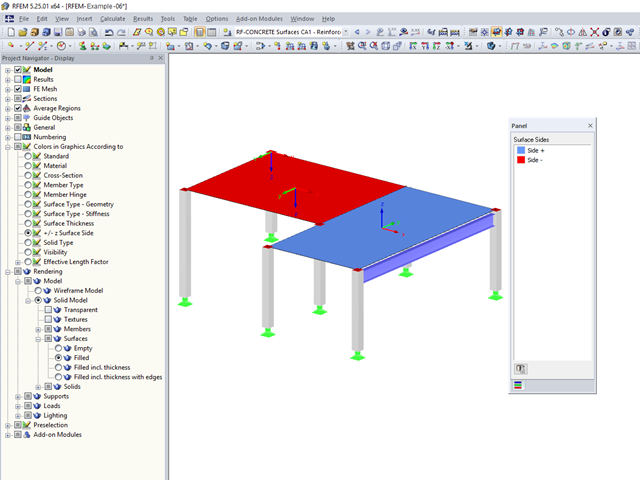
You can color the surfaces in the direction of the local z‑axis using the indicated option in the Display Navigator. By default, the side lying in the negative z-direction is colored red and the side lying in the positive z-direction is colored blue.
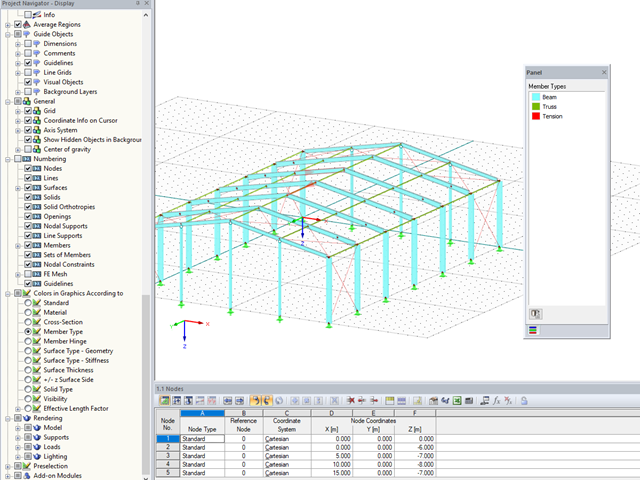
In RFEM and RSTAB, you can now also display and check the types of members used visually, by means of colors. To do this, an option has been integrated into the Display Navigator.
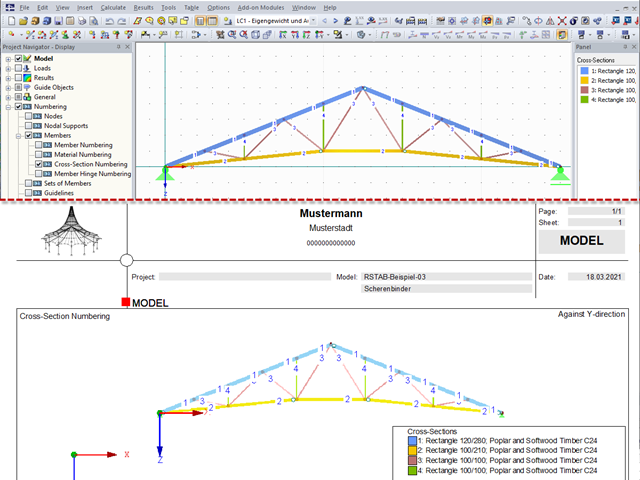
For a quick overview of the cross‑sections used, you can show the members in color sorted by cross‑section. Use the right mouse button in the work window to select "Colors in Graphics According to" → "Cross -Sections" from the shortcut menu. In the current program versions, you can use a panel with an editable color scale for this.
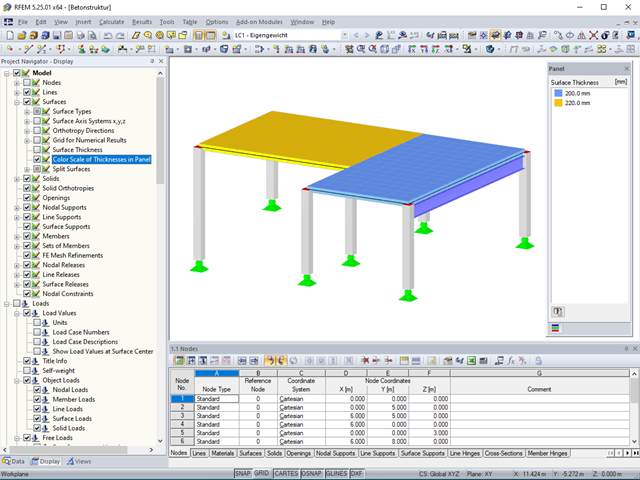
Surface thicknesses can be visualized in the model using various colors.
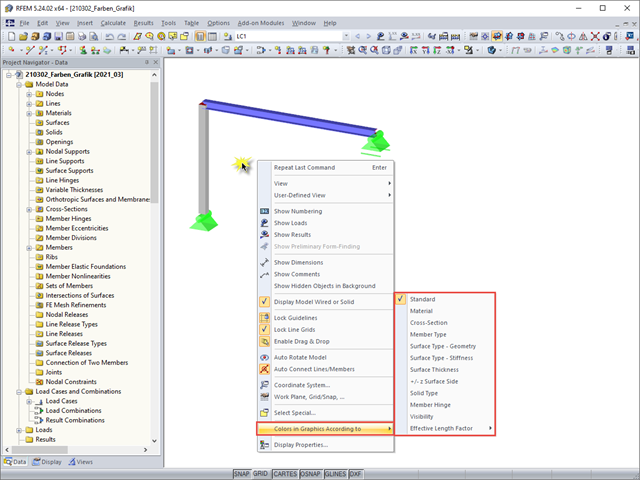
For a clearer display of the structure, you can display it in different colors. The corresponding selection can be opened by right-clicking the work window.
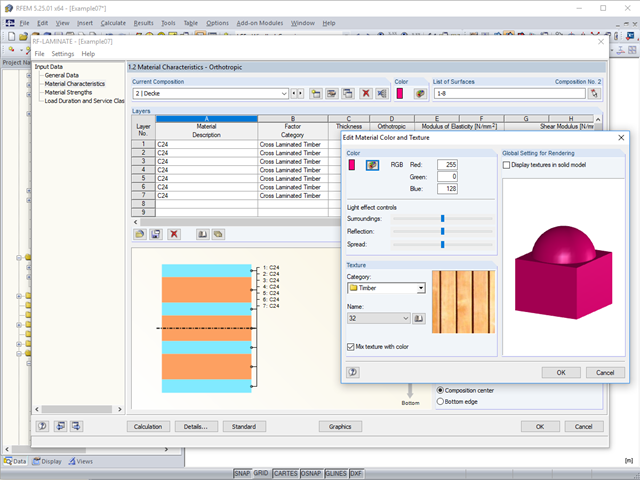
To better distinguish between the different layer compositions (for example, for walls and ceilings), you can assign user‑defined colors and textures to each composition.
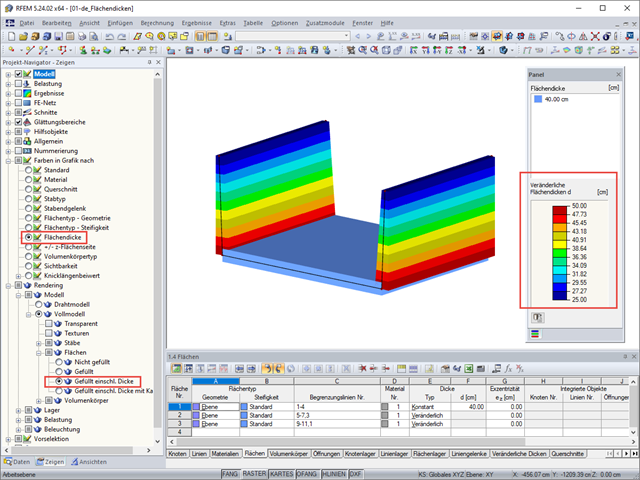
RFEM 5 allows you to show the variable surface thicknesses as a color gradient.
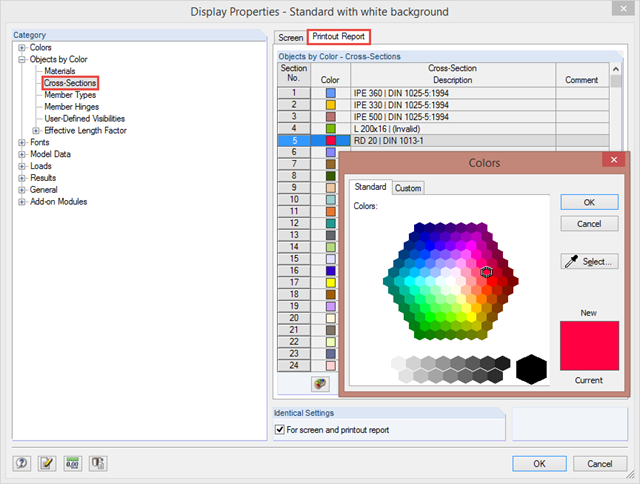
By clicking "Options" → "Display Properties" → "Edit", you can change and save display settings for printout reports and your screen. For example, you can set individual colors for cross‑sections.
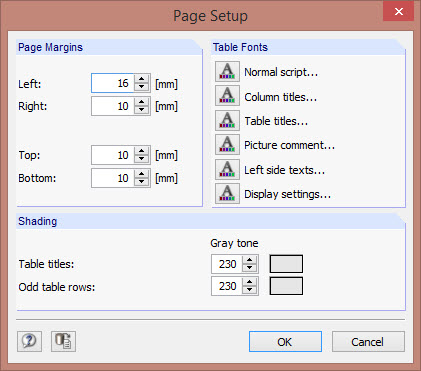
The layout of a printout report can be adjusted by changing fonts, font colors, page margins, and table shading.