
Are you looking for a formula relevant for your structural design? Just ask our AI chatbot Mia!
Mia shows you the right formula, with explanations, if necessary.
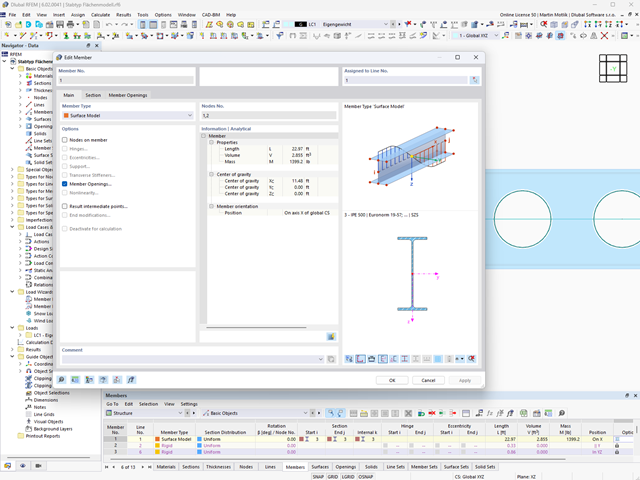
Can you use some support? The "surface model" member type helps you to simulate a member as a surface model in the overall model.
This feature provides you with the following:
- Quick input using a member with a cross-section
- Simulation of openings in the web
- Simultaneous output of the member and surface results
- Design of member results in the add-on
- Consideration of a real stress distribution
You can use the surface member for the following applications, among others:
- Castellated beams
- Perforated beams
- Beams with rectangular openings
- Vierendeel trusses
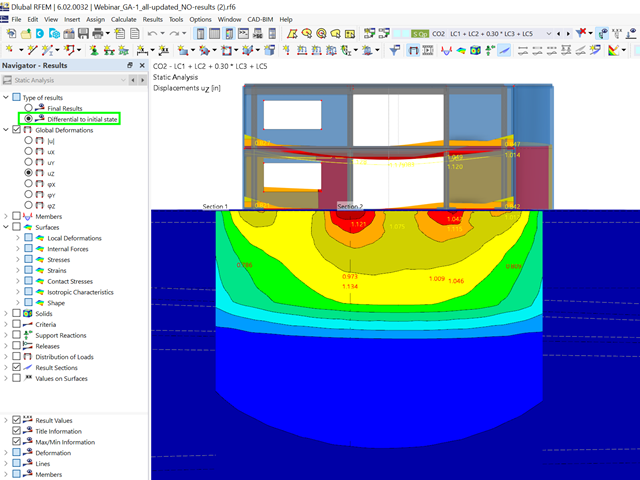
Did you already know? For load combinations, you can optionally display the difference results to the initial state. For example, you have the option for a geotechnical analysis to output the settlement as a difference to the initial state "soil self-weight".
.png?mw=640&hash=55038d2a1591f62179796666cb9b2fede0274e19)
A graphical and tabular output of the results for deformations, stresses, and strains helps you when determining the soil solids. To achieve this, use the special filter criteria for targeted selection of results.
The program doesn't leave you alone with the results. If you want to graphically evaluate the results in the soil solids, you can use the guide objects. For example, you can define clipping planes. This allows you to view the corresponding results in any plane of the soil solid.
And not just that. The utilization of result sections and clipping boxes facilitates the precise graphical analysis of the soil solid.
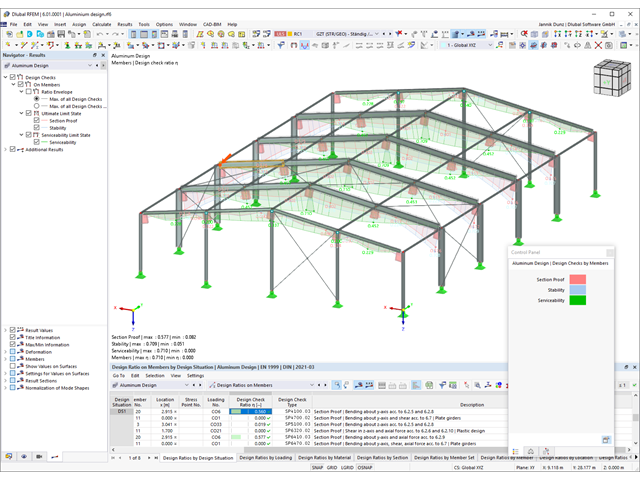
You can find the design checks displayed in tables in the Aluminum Design add-on. Moreover, you can display the distribution of the design ratios graphically. Extensive filter options are available for you both in the table as well as in the graphical output. You can thus specifically display the desired design checks by limit state or design type in the program.
Was your design successful? Very good, now comes the relaxed part. Because the program gives you the performed design checks in a table. You can display all result details in detail here. The clearly presented design formulas ensure that you will be able to understand the results without any problems. There is no black-box effect with Dlubal Software.
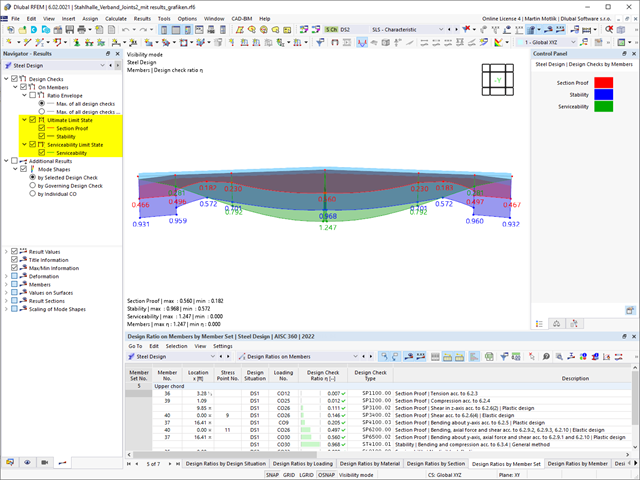
The design checks are carried out at all governing locations of the members and displayed graphically as a result diagram. You can find more detailed graphics in the result output. This includes the stress distribution on the cross-section or the governing mode shape, for example.
All input and result data are part of the RFEM/RSTAB printout report. You can select the report contents and extent specifically for the individual design checks.
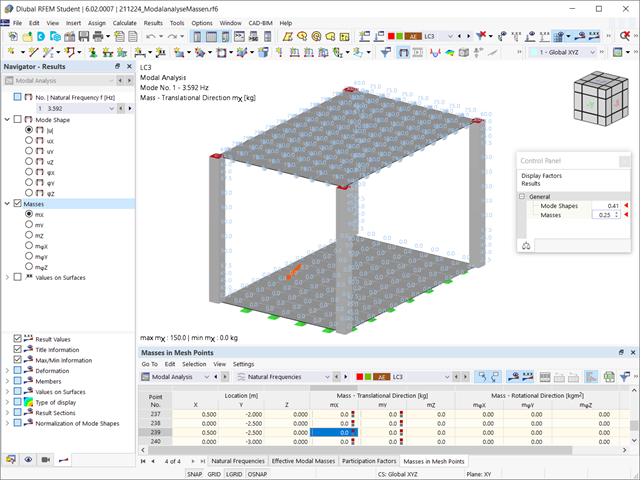
Have you already discovered the tabular and graphical output of masses in mesh points? That's right, this is also part of the modal analysis results in RFEM 6. This way, you can check the imported masses that depend on various settings of the modal analysis. They can be displayed in the Masses in Mesh Points tab of the Results table. The table provides you with an overview of the following results: Mass - Translational Direction (mX, mY, mZ), Mass - Rotational Direction (mφX, mφY, mφZ), and the Sum of Masses. Would it be best for you to have a graphical evaluation as quickly as possible? Then you can also graphically display the masses in mesh points.
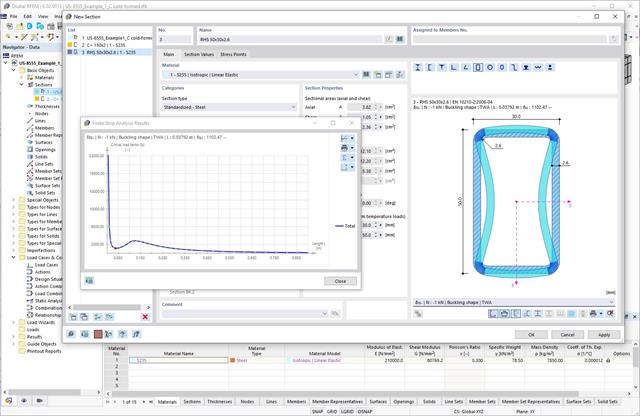
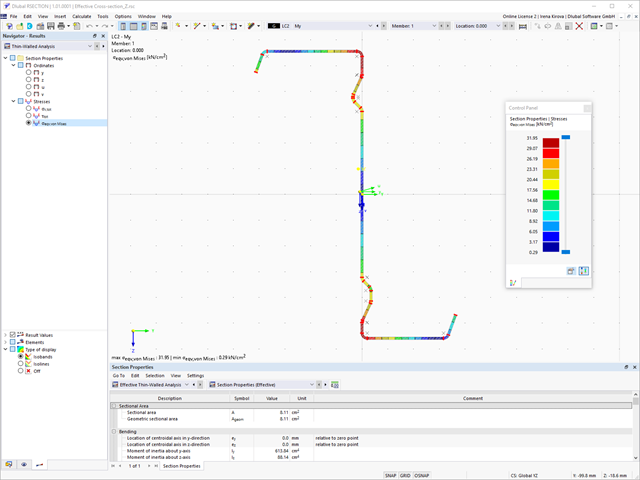
When performing a design according to EN 1993‑1‑3, it is possible to graphically display a mode shape for the distortional buckling of a cross-section, and for the RSECTION cross-sections.
The mode shape can also be output in RSECTION 1 for library cross-sections.
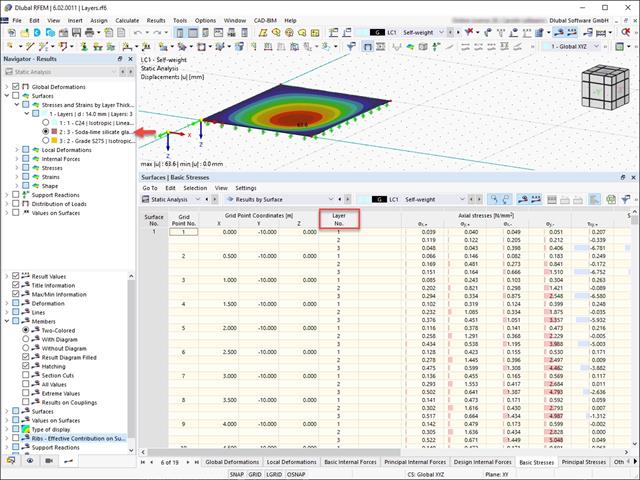
The stress and strain results by surface can be output in the surface result table according to the thickness layer.
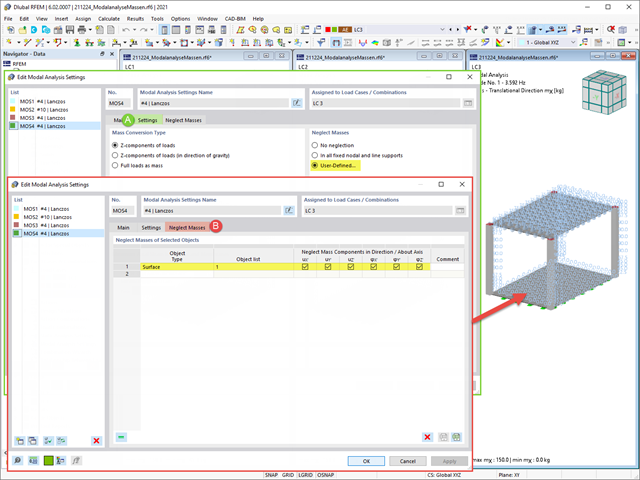
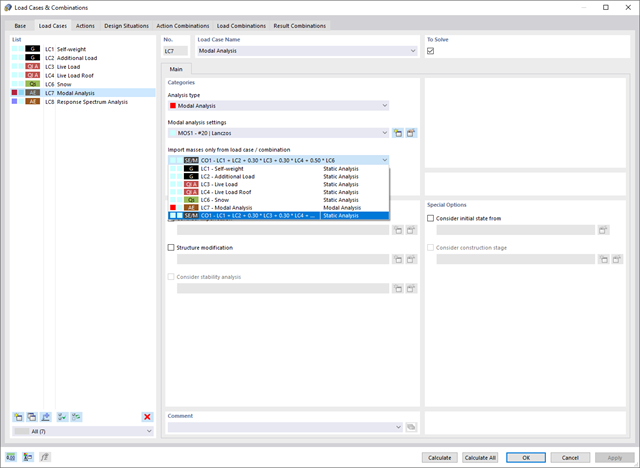
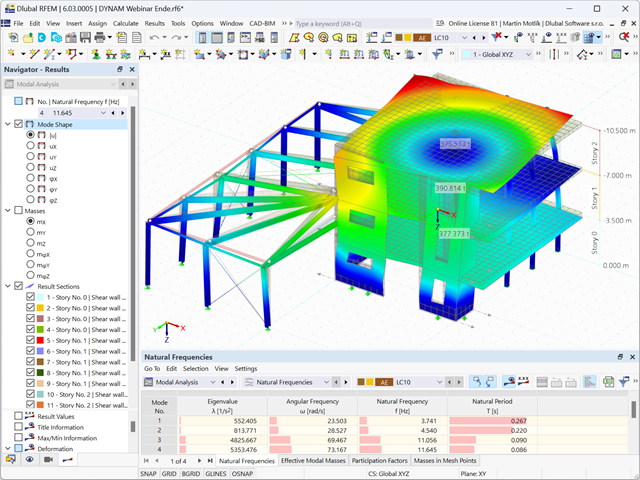
It is often necessary to neglect masses. This is particularly the case when you want to use the output of the modal analysis for the seismic analysis. For this, 90% of the effective modal mass in each direction is required for the calculation. So you can neglect the mass in all fixed nodal and line supports. The program automatically deactivates the associated masses for you.
You can also manually select the objects whose masses are to be neglected for the modal analysis. We have shown the latter in the image for a better view. A user-defined selection is made the and the objects with their associated mass components are selected to neglect the masses.

- A wide range of cross-sections, such as rectangular sections, square sections, T‑sections, circular sections, built-up cross-sections, irregular parametric cross-sections, and many others (suitability for design depends on the selected standard)
- Design of cross-laminated timber (CLT)
- Design of timber-based materials and laminated veneer lumber according to EC 5
- Design of tapered and curved members (design method according to the standard)
- Adjustment of the essential design factors and standard parameters is possible
- Flexibility due to detailed setting options for basis and extent of calculations
- Fast and clear results output for an immediate overview of the result distribution after the design
- Detailed output of the design results and essential formulas (comprehensible and verifiable result path)
- Numerical results clearly arranged in tables and graphical display of the results in the model
- Integration of the output into the RFEM/RSTAB printout report
Are you still looking for the design? The design checks are available in tabular form in the Timber Design add-on. Moreover, the program can also show you the distribution of the design ratios graphically. Extensive filter options are available for you in the table as well as in the graphical output, and you can use them to display the desired design checks by limit state or design type.
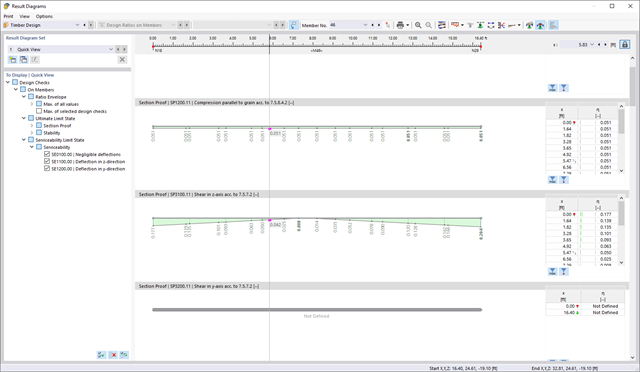
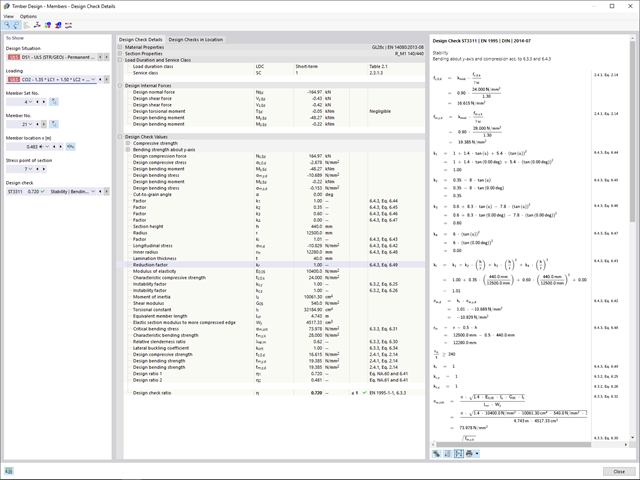
If your design is successful, the relaxed part of your work follows. Because the program does many processes for you. For example, the performed design checks are displayed in a table. It shows you all the result details. Due to the clearly presented design formulas, you will be able to understand the results without any problems. There is no "black box" effect here.
The design checks are carried out at all governing locations of the members and displayed graphically as a result diagram. Furthermore, detailed graphics, such as the stress distribution on a cross-section or the governing mode shape, are available for you in the result output.
All input and result data are part of the RFEM/RSTAB printout report. You can select the report contents and extent specifically for the individual design checks.
You can find the design checks directly in the Steel Design add-on. They are available there in a tabular form. You can also display the distribution of the design ratios graphically. Both the table and the graphical output provide you with the extensive filter options. You can thus specifically display the desired design checks by limit state or by design type.

Reinforced concrete usually answers the question "How much can you carry?" simply with "Yes". Nevertheless, you need a three-dimensional moment-moment-axial force interaction diagram for the graphical output of the ultimate limit state of reinforced concrete cross-sections. The Dlubal structural analysis software offers you just that.
With the additional display of the load action, you can easily recognize or visualize whether the limit resistance of a reinforced concrete cross-section is exceeded. Since you can control the diagram properties, you can customize the appearance of the My-Mz-N diagram to suit your needs.
- Calculation of stationary incompressible turbulent wind flow using the SimpleFOAM solver from the OpenFOAM® software package
- Numerical scheme according to the first and second order
- Turbulence models RAS k-ω and RAS k-ε
- Consideration of surface roughness depending on model zones
- Model design via VTP, STL, OBJ, and IFC files
- Operation via bidirectional interface of RFEM or RSTAB for importing model geometries with standard-based wind loads and exporting wind load cases with probe-based printout report tables
- Intuitive model changes via drag & drop and graphical adjustment assistance
- Generation of a shrink-wrap mesh envelope around the model geometry
- Consideration of environmental objects (buildings, terrain, and so on)
- Height-dependent description of the wind load (wind speed and turbulence intensity)
- Automatic meshing depending on a selected depth of detail
- Consideration of layer meshes near the model surfaces
- Parallelized calculation with optimal utilization of all processor cores of a computer
- Graphical output of the surface results on the model surfaces (surface pressure, Cp coefficients)
- Graphical output of the flow field and vector results (pressure field, velocity field, turbulence – k-ω field, and turbulence – k-ε field, velocity vectors) on Clipper/Slicer planes
- Display of 3D wind flow via animated streamline graphics
- Definition of point and line probes
- Multilingual user interface (German, English, Czech, Spanish, French, Italian, Polish, Portuguese, Russian, and Chinese)
- Calculations of several models in one batch process
- Generator for creating rotated models to simulate different wind directions
- Optional interruption and continuation of the calculation
- Individual color panel per result graphic
- Display of diagrams with separate output of results on both sides of a surface
- Output of the dimensionless wall distance y+ in the mesh inspector details for the simplified model mesh
- Determination of the shear stress on the model surface from the flow around the model
- Calculation with an alternative convergence criterion (you can select between the residual types pressure or flow resistance in the simulation parameters)
By solving the numerical flow problem, you can obtain the following results on and around the model:
- Pressure on structure surface
- Coefficient Cp distribution on the structure surfaces
- Pressure field about the structure geometry
- Velocity field about the structure geometry
- Turbulence k-ω field about the structure geometry
- Turbulence k-ε field about the structure geometry
- Velocity vectors about the structure geometry
- Streamlines about the structure geometry
- Forces on member-shaped structures that were originally generated from member elements
- Convergence diagram
- Direction and size of the flow resistance of the defined structures
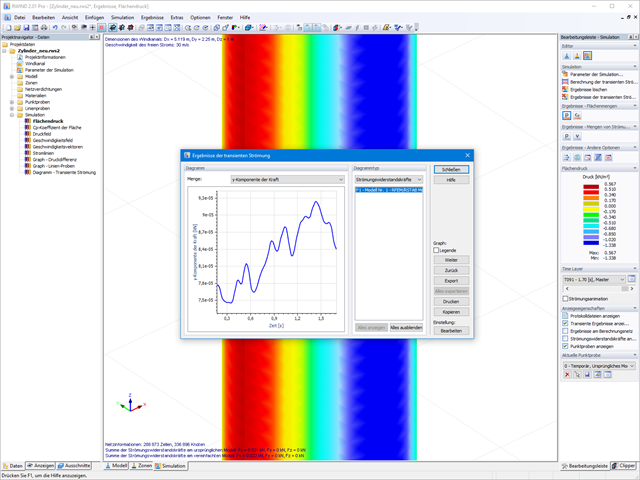
Despite this amount of information, RWIND 2 remains clearly arranged, as is typical for the Dlubal programs. You can specify freely definable zones for a graphic evaluation. Voluminously displayed flow results about the structure geometry are often confusing – you know the problem for sure. That's why RWIND Basic provides freely movable section planes for the separate display of the "solid results" in a plane. For the 3D branched streamline result, you have an option to select between a static and an animated display in the form of moving line segments or particles. This option helps you to represent the wind flow as a dynamic effect.
You can export all results as a picture or, especially for the animated results, as a video.
Discover the fundamentally revised and optimized printout report. It offers you the following innovations, among other things:
- Quick creation due to non-modal printout report environment (parallel work in program and report possible)
- Interactive modification of chapters as well as creation of new user-defined chapters
- Import of PDFs, formulas, 3D graphics, and so on
- Output of the design check formulas used in the design (including a reference to the used equation from the standard)
- Modern printout report design
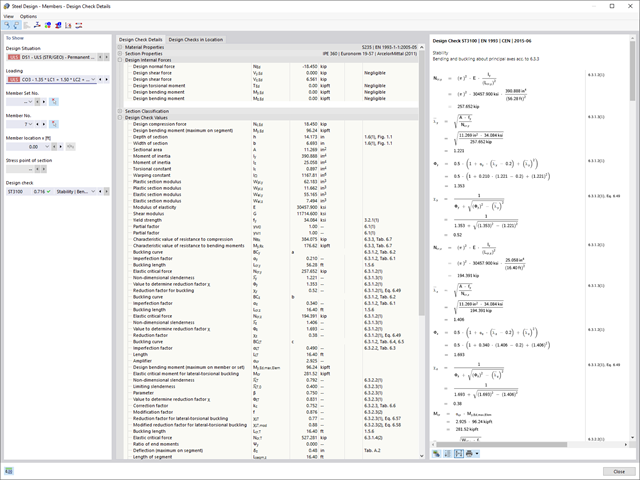
With Dlubal Software, you always have an overview, regardless of whether your projects are from the reinforced concrete, steel, timber, aluminum, or other industry. The program clearly displays the design check formulas used in your design (including a reference to the used equation from the standard). These design check formulas can also be included in the printout report.
Go to Explanatory Video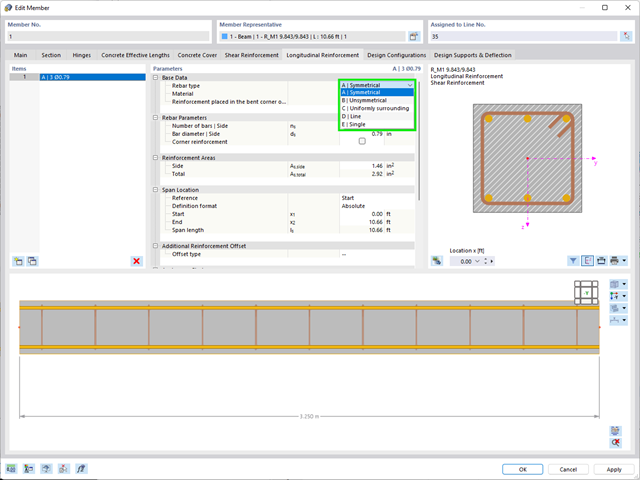
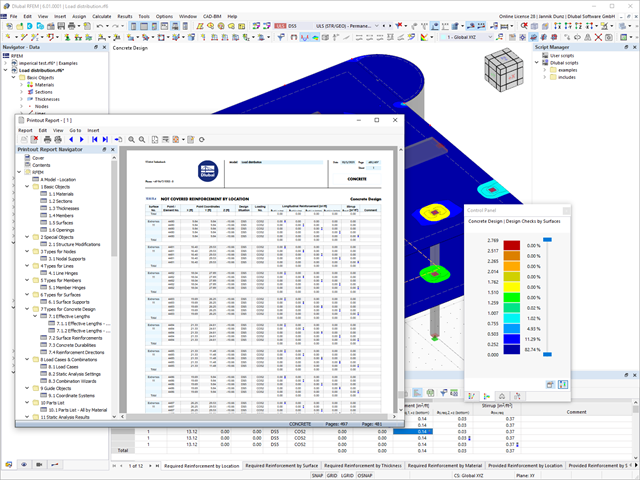
The Concrete Design add-on combines all CONCRETE add-on modules from RFEM 5 / RSTAB 8. Compared to these add-on modules, the following new features have been added to the Concrete Design add-on for RFEM 6 / RSTAB 9:
- Input of design-relevant specifications (effective lengths, durability, reinforcement directions, surface reinforcement) directly in the RFEM or RSTAB model
- Extensive input options for longitudinal and transverse reinforcement of members
- Detailed intermediate results for the design with specification of the equations of the applied standard for better traceability of the calculation
- New interaction diagram with interactive graphic for N, M, and M + N from cross-section design incl. output of the secant and tangent stiffness
- Design of the defined reinforcement in the ultimate limit state and serviceability limit state incl. graphical output of the design ratio for the respective component
- Automatic check of the defined reinforcement with regard to the construction or general reinforcement rules for reinforced member and surface components
- Cross-section design optionally with net values of the concrete section
- Design according to the Russian standard SP 63.13330
Compared to the RF‑/STEEL EC3 add-on module (RFEM 5 / RSTAB 8), the following new features have been added to the Steel Design add-on for RFEM 6 / RSTAB 9:
- In addition to Eurocode 3, other international standards are integrated (such as AISC 360, CSA S16, GB 50017, SP 16.13330)
- Consideration of hot-dip galvanizing (DASt guideline 027) in the fire protection design according to EN 1993‑1‑2
- Input option for transverse stiffeners that can be taken into account in the shear buckling analysis
- Lateral-torsional buckling can also be checked for hollow sections (for example, relevant for slender, high rectangular hollow sections)
- Automatic detection of members or member sets valid for the design (for example, automatic deactivation of members with invalid material or members already contained in a member set)
- Design settings can be adjusted individually for each member
- Graphical display of the results in the gross section or the effective section
- Output of the used design check formulas (including a reference to the used equation from the standard)
Compared to the RF‑/TIMBER Pro add-on module (RFEM 5 / RSTAB 8), the following new features have been added to the Timber Design add-on for RFEM 6 / RSTAB 9:
- In addition to Eurocode 5, other international standards are integrated (SIA 265, ANSI/AWC NDS, CSA O86, GB 50005)
- Design of compression perpendicular to grain (support pressure)
- Implementation of eigenvalue solver for determining the critical moment for lateral-torsional buckling (EC 5 only)
- Definition of different effective lengths for design at normal temperature and fire resistance design
- Evaluation of stresses via unit stresses (FEA)
- Optimized stability analyses for tapered members
- Unification of the materials for all national annexes (only one "EN" standard is now available in the material library for a better overview)
- Display of cross-section weakenings directly in the rendering
- Output of the used design check formulas (including a reference to the used equation from the standard)
Compared to the RF‑/ALUMINUM add-on module (RFEM 5 / RSTAB 8), the following new features have been added to the Aluminum Design add-on for RFEM 6 / RSTAB 9:
- In addition to Eurocode 9, the US standard ADM 2020 is integrated.
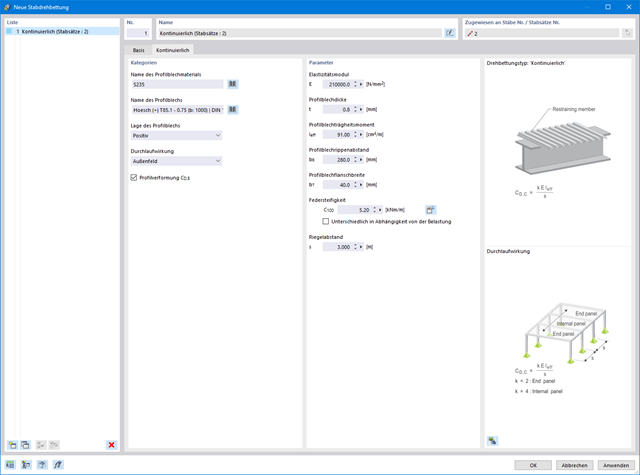
- Consideration of the stabilizing effect of purlins and sheets by rotational restraints and shear panels
- Graphical display of the results in the gross section
- Output of the used design check formulas (including a reference to the used equation from the standard)
Compared to the RF‑/DYNAM Pro - Natural Vibrations add-on module (RFEM 5 / RSTAB 8), the following new features have been added to the Modal Analysis add-on for RFEM 6 / RSTAB 9:
- Preset combination coefficients for various standards (EC 8, ASCE, and so on)
- Optional neglect of masses (for example, mass of foundations)
- Methods for determining the number of mode shapes (user-defined, automatic - to reach effective modal mass factors, automatic - to reach the maximum natural frequency)
- Output of modal masses, effective modal masses, modal mass factors, and participation factors
- Masses in mesh points displayed in tables and graphics
- Various scaling options for mode shapes in the Result navigator

Compared to the RF‑SOILIN add-on module (RFEM‑5), the following new features have been added to the Geotechnical Analysis add-on for RFEM 6:
- Creation of the layered soil as a 3D model from the entirety of the defined soil samples
- Recognized material law according to Mohr-Coulomb for soil simulation
- Graphical and tabular output of stresses and strains at any depth of the soil
- Optimal consideration of the soil-structure interaction on the basis of an overall model

Compared to the RF‑/STEEL add-on module (RFEM 5 / RSTAB 8), the following new features have been added to the Stress-Strain Analysis add-on for RFEM 6 / RSTAB 9:
- Treatment of members, surfaces, solids, welds (line welded joints between two and three surfaces with subsequent stress design)
- Output of stresses, stress ratios, stress ranges, and strains
- Limit stress depending on the assigned material or a user-defined input
- Individual specification of the results to be calculated through freely assignable setting types
- Non-modal result details with prepared formula display and additional result display on the cross-section level of members
- Output of the design check formulas used
Are you just waiting for your results after the design? The design results are displayed in the usual way in the Steel Design add-on. In the corresponding output tables, you can find the classification, the effective section properties, and the design check, among other things. The stresses are displayed to you graphically on the effective section as well as on the gross section.
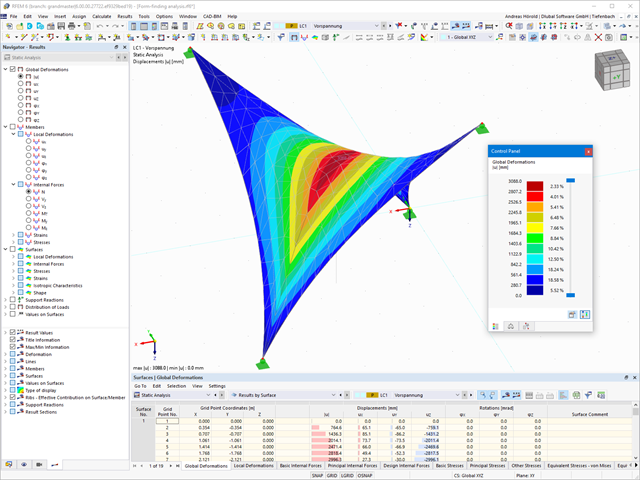
The form-finding process gives you a structural model with active forces in the "prestress load case" This load case shows the displacement from the initial input position to the form-found geometry in the deformation results. In the force or stress-based results (member and surface internal forces, solid stresses, gas pressures, and so on), it clarifies the state for maintaining the found form. For the analysis of the shape geometry, the program offers you a two-dimensional contour line plot with the output of the absolute height and an inclination plot for the visualization of the slope situation.
Now, a further calculation and structural analysis of the entire model is performed. For this purpose, the program transfers the form-found geometry including the element-wise strains into a universally applicable initial state. You can now use it in the load cases and load combinations.
- Automatic consideration of masses from self-weight
- Direct import of masses from load cases or load combinations
- Optional definition of additional masses (nodal, linear, or surface masses, as well as inertia masses) directly in the load cases
- Optional neglect of masses (for example, mass of foundations)
- Combination of masses in different load cases and load combinations
- Preset combination coefficients for various standards (EC 8, SIA 261, ASCE 7,...)
- Optional import of initial states (for example, to consider prestress and imperfection)
- Structure Modification
- Consideration of failed supports or members/surfaces/solids
- Definition of several modal analyses (for example, to analyze different masses or stiffness modifications)
- Selection of mass matrix type (diagonal matrix, consistent matrix, unit matrix), including user-defined specification of translational and rotational degrees of freedom
- Methods for determining the number of mode shapes (user-defined, automatic - to reach effective modal mass factors, automatic - to reach the maximum natural frequency - only available in RSTAB)
- Determination of mode shapes and masses in nodes or FE mesh points
- Results of eigenvalue, angular frequency, natural frequency, and period
- Output of modal masses, effective modal masses, modal mass factors, and participation factors
- Masses in mesh points displayed in tables and graphics
- Visualization and animation of mode shapes
- Various scaling options for mode shapes
- Documentation of numerical and graphical results in printout report
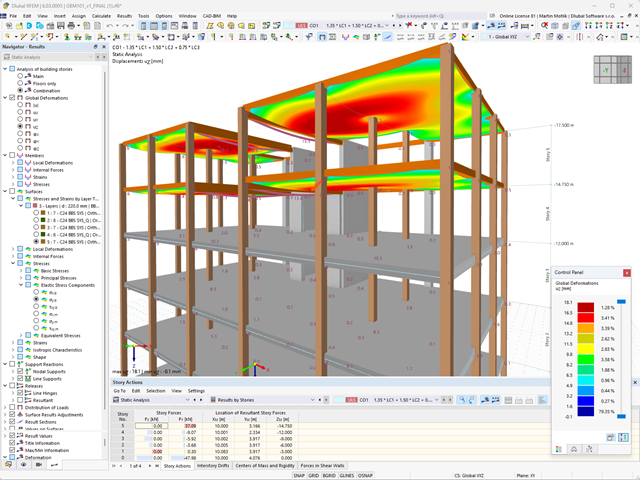
- Consideration and display of story masses
- Listing of structural elements and their information
- Automated creation of result sections on shear walls
- Output of section resultants in global direction for determining shear forces
- Optional definition of rigid diaphragm by story (story modeling)
- Stiffness type Floor Slab - Rigid Diaphragm
- Defining floor sets,
- for example, calculation of slabs as a 2D position within the 3D model
- Shear walls: Automatic definition of result members with any cross-section
- Design of rectangular cross-sections using the Concrete Design add-on
- Definition of deep beams
- Design with the Concrete Design add-on
- Tabular output of story actions, interstory drift, and center points of mass and stiffness, as well as the forces in shear walls
- Separate result display of the floor and stiffening design
- Optional neglecting of openings of a certain size