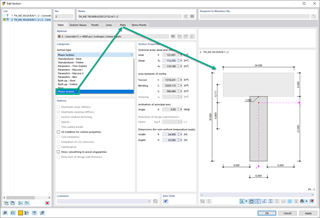
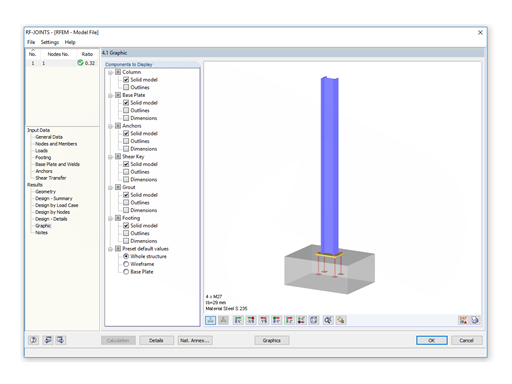
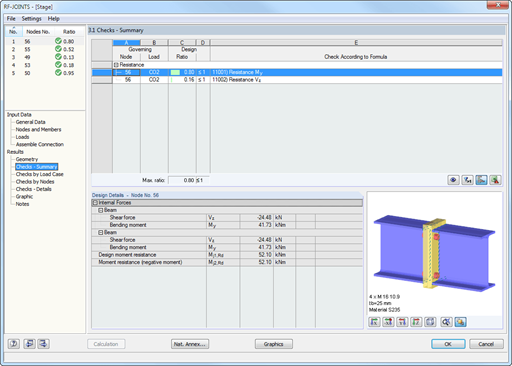
After the design, all results are displayed in clearly arranged result tables; for example, by load case or by node. The governing internal forces are compared with the limit values listed in the DSTV guideline.
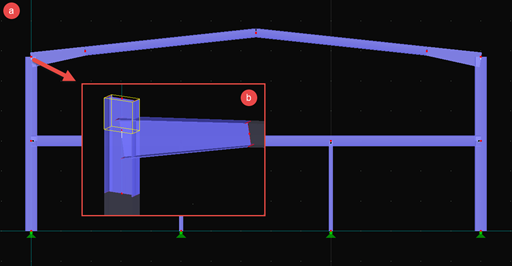
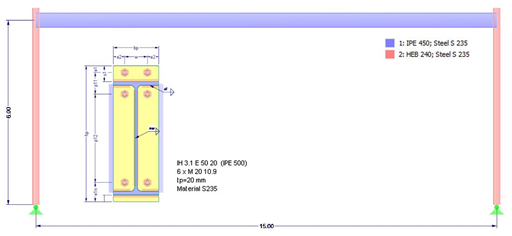
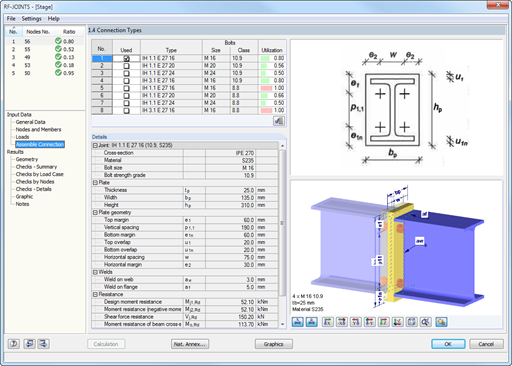
You can visualize the joints graphically in the add-on module or in RFEM/RSTAB. In addition to the input and result data, including design details displayed in tables, you can add all graphics into the printout report. This way, comprehensible and clearly arranged documentation is guaranteed.


.png?mw=512&hash=946cd2867d0701e2a5a72de20f45b351b3ea8f93)


.png?mw=600&hash=49b6a289915d28aa461360f7308b092631b1446e)