67 Results
View Results:
Sort by:
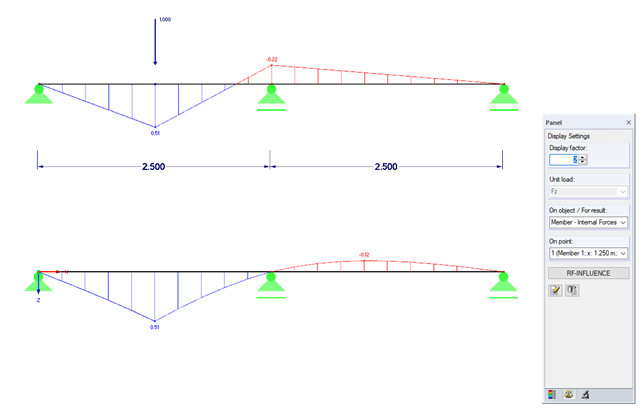
Influence lines are less important nowadays due to fast computer systems. However, it might be an advantage to use influence lines in the phase of preliminary design, as well as in the actual creation of the structural designs. With the RF-INFLUENCE add-on module, influence lines and influence surfaces can be generated and evaluated easily due to a fixed internal force. This technical article describes, with a simple example, the basics of determining and evaluating influence lines.
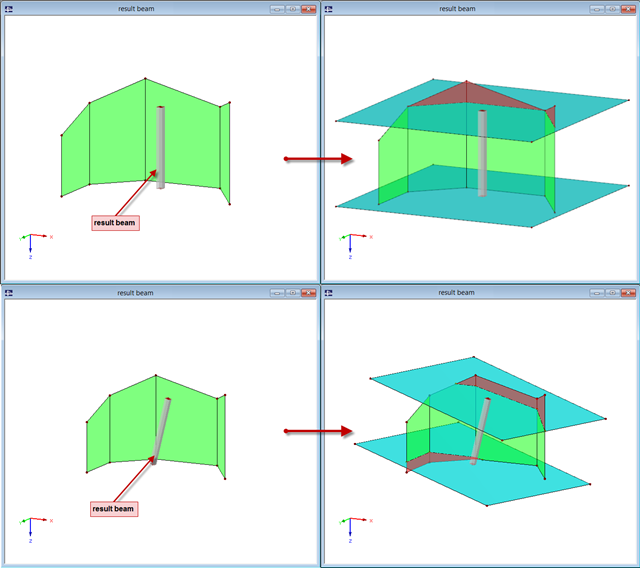
The "Result Beam" member type has been available since the release of RFEM 5. The result beam is a virtual member that does not have any stiffness nor require any support. It can be used in various situations in order to integrate the results from members, surfaces, and solids, and to display them as member internal forces.
The story drift of a building provides valuable information about its structural behavior under seismic loads. These could cause large horizontal deformations and even instabilities. Some standards, therefore, call for a check of the story drift in its center of gravity. It indicates, for example, if a second-order analysis (P-Δ effect) is necessary.
- 001541
- Results
- RFEM 5
-
- RF-DYNAM Pro | Natural Vibrations 5
- RF-DYNAM Pro | Equivalent Loads 5
- RF-DYNAM Pro | Forced Vibrations 5
- RSTAB 8
- DYNAM Pro | Natural Vibrations 8
- DYNAM Pro | Equivalent Loads 8
- Concrete Structures
- Steel Structures
- Timber Structures
- Process Manufacturing Plants
- Power Plants
- Buildings
- Dynamic and Seismic Analysis
- ASCE 7
RFEM offers the option to perform a response spectrum analysis according to ASCE 7-16. This standard describes the determination of seismic loads for the American market. It might happen that the P-Delta effect has to be considered due to the stiffness of the entire structure in order to calculate the internal forces and carry out the design.
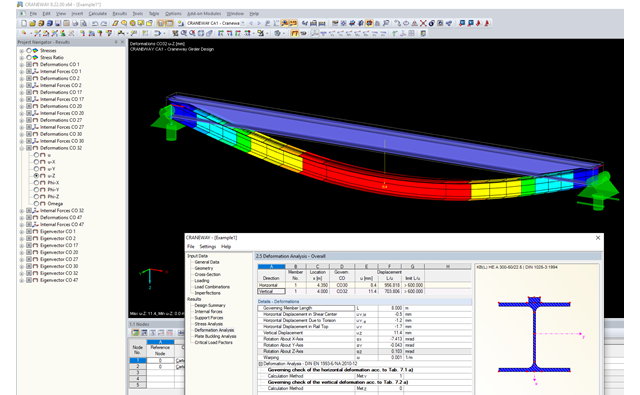
This article describes the different options for determining the allowable deformation of crane runway girders. Since multi-span beams and flexible lateral supports (sway bracing) are used in practice, this article will show how to select the correct method.
When performing control calculations and comparing the internal forces and the resulting required reinforcement of downstand beams, large differences can occur. Although the same load assumptions and spans are applied, some programs or the manual calculation display very different internal forces compared to the FEA model. The differences already occur in the case of the centric member and without considering the internal forces' components from the possible effective slab widths.
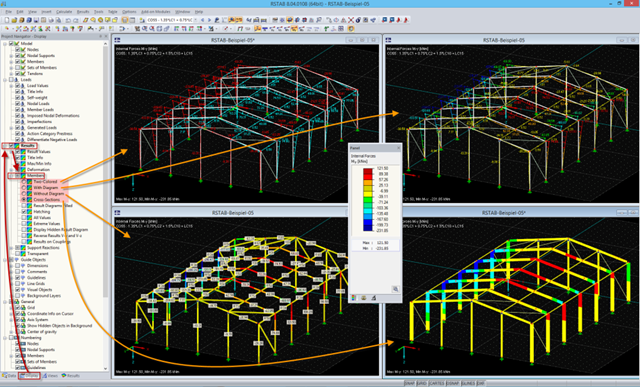
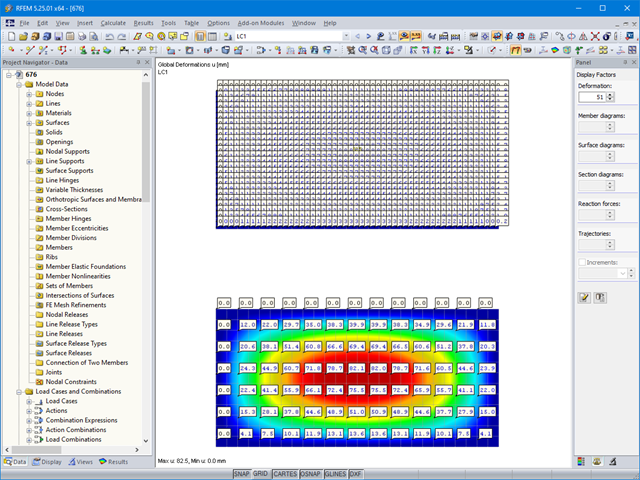
In the RFEM and RSTAB work window, four display modes are available for the results of members. They can be selected in the Display Navigator under "Results" → "Members".
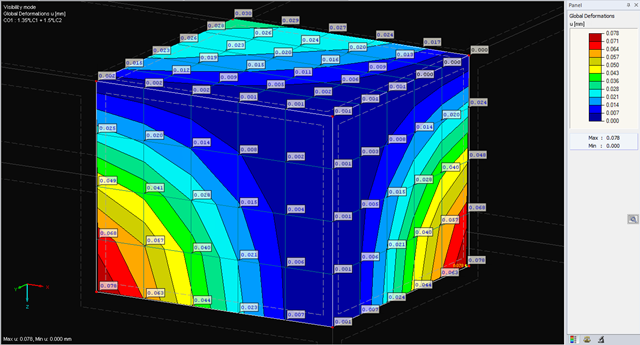
The deformations of the FE nodes are always the first result of an FE calculation. It is possible to calculate strains, internal forces, and stresses based on these deformations and the stiffness of the elements.
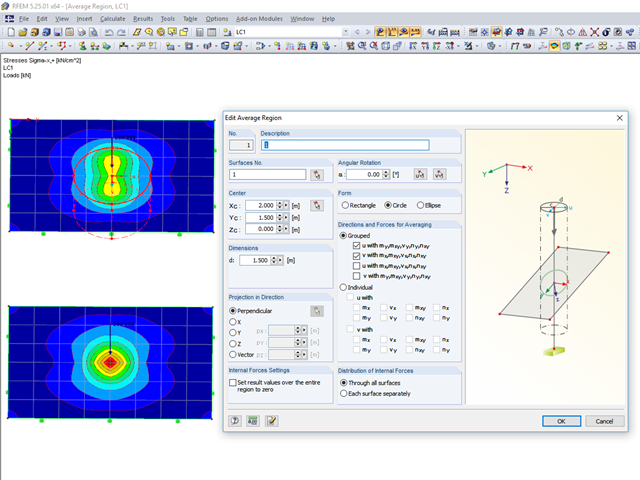
RFEM 5 provides the option to define a smoothing area in the "Results" → "New Average Region" menu. You can choose a rectangular, circular, or elliptical shape. With this tool you can, for example, "smooth" singularities due to nodal loads in a desired averaged region.
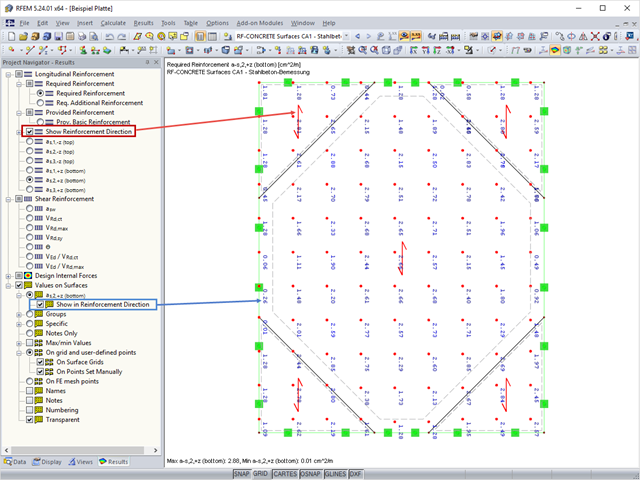
In RF‑CONCRETE Surfaces, the design of the surface reinforcement is done by means of a freely definable reinforcement mesh. In RF‑CONCRETE Surfaces, you can display the reinforcement direction by activating the reinforcement arrow that represents it.
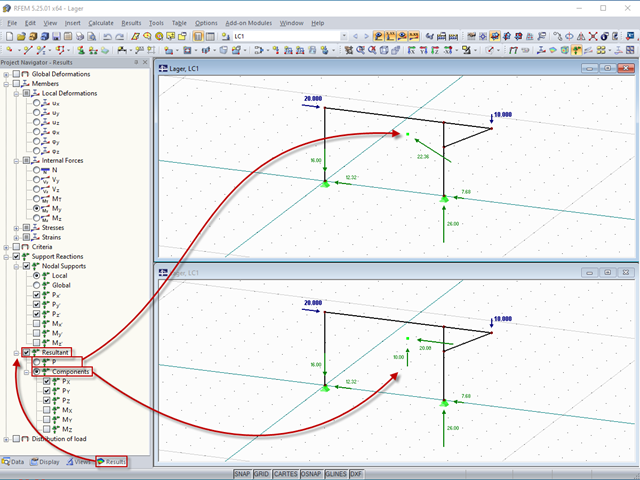
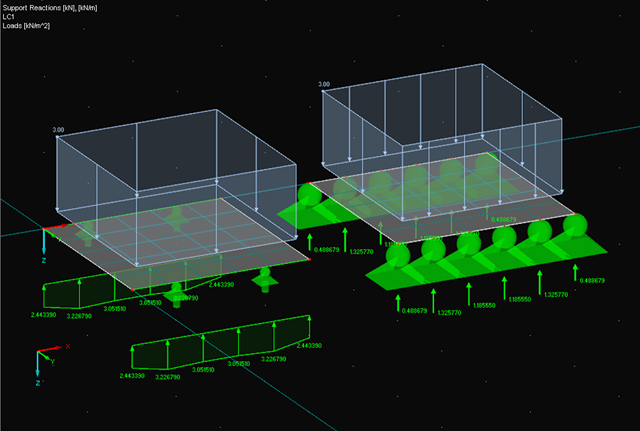
In RFEM 5 and RSTAB 8, you can display the resulting support force related to the centroid of the model. It can be used, for example, to check the model and load data.
When calculating a surface model, the internal forces are determined separately for each finite element. Since the element-by-element results usually represent a discontinuous distribution, RFEM performs smoothing of the internal forces that takes into account the influence of adjacent elements. The discontinuous distribution of internal forces is adjusted with this method. The result evaluation is thus clearer and easier.
When evaluating line support forces, implausible diagrams sometimes arise at first glance. In particular, for variable loads at locations that also have a nodal support, at division points and edge locations of supported lines, the results sometimes show unexpected support reactions. Using the function of the linear smooth distribution in Project Navigator – Display does not always lead to the expected result diagram.
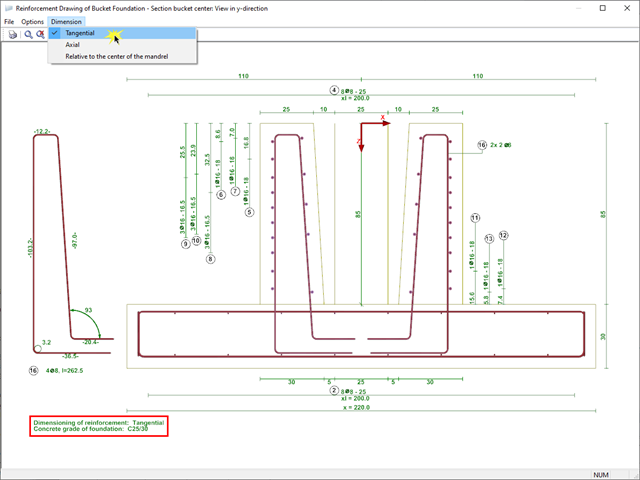
In RF‑/FOUNDATION Pro, reinforcement drawings are displayed after designing the foundation, where you can record all necessary structures of the reinforcement steel.
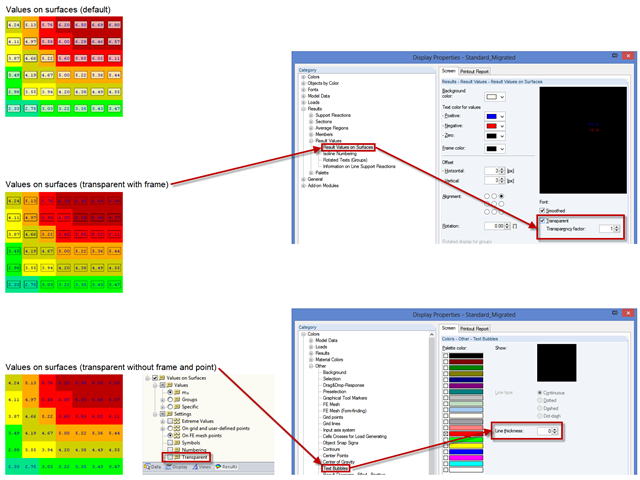
You can make various settings in order to achieve a clearly‑arranged display of the result values. For example, some users may not want the white background in text bubbles. You can adjust the background in "Display Properties" using the Transparent and Background color option.
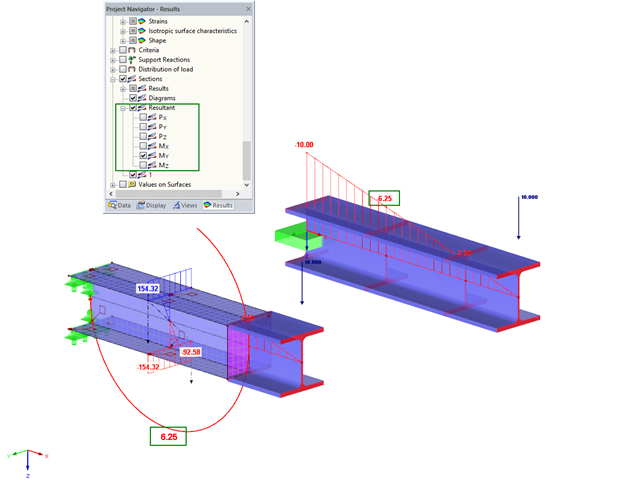
For control purposes, it is possible to display the resulting internal force in sections in RFEM. To illustrate this, the bending moment was selected in this example.
For relatively large or relatively small surfaces, it can happen that the automatically created result values do not fit the model: In the case of large surfaces, there can be too many result values; in the case of small surfaces, too few.
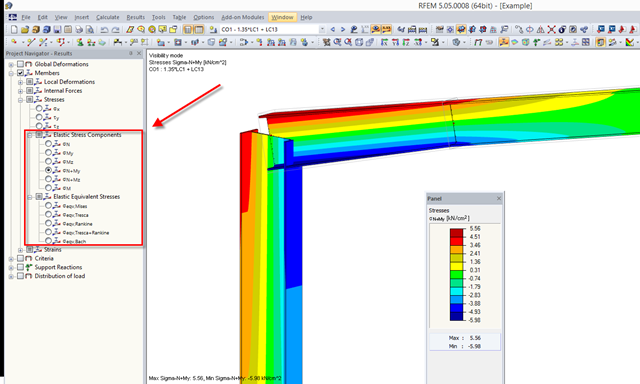
RFEM 5.04.xx allows for graphical visualization of normal and shear stress of members (this feature is available only if the RF‑STEEL add‑on module is licensed).
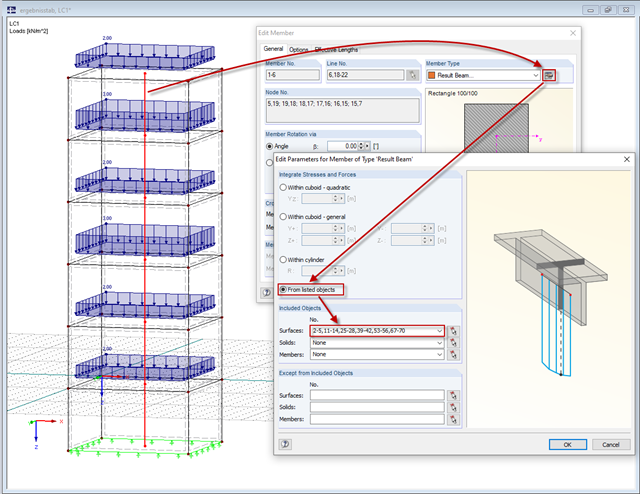
The new "Result Beam" member type in RFEM 5 allows you to determine the load sums of individual floors easily. To do this, model a member in the relevant floor or in all floors, then specify the relevant walls as inclusive objects in the parameters of the result beam. RFEM then integrates the surface internal forces into member internal forces.
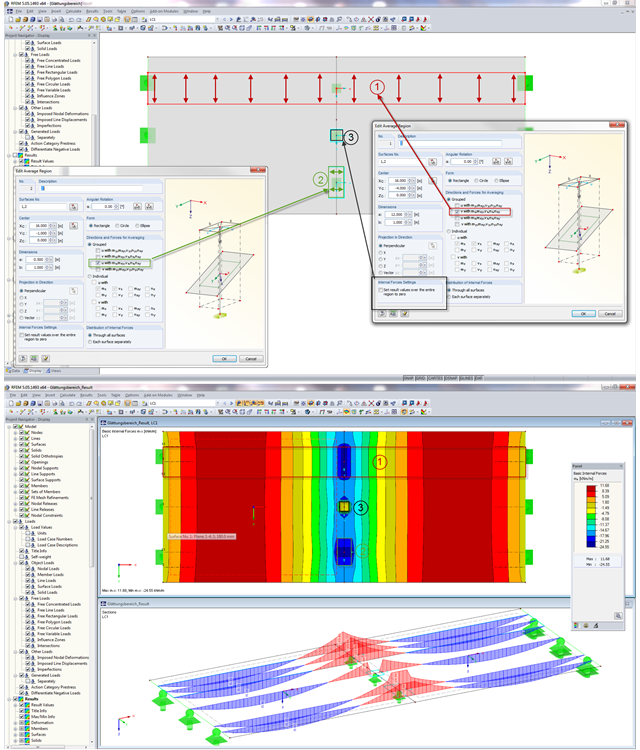
In RFEM, areas can be defined where the internal forces in surfaces are not displayed with the real distribution from FE calculation, but as mean values. You can use various settings for averaging the internal forces. There are three possible application areas of the "Average Region" function.