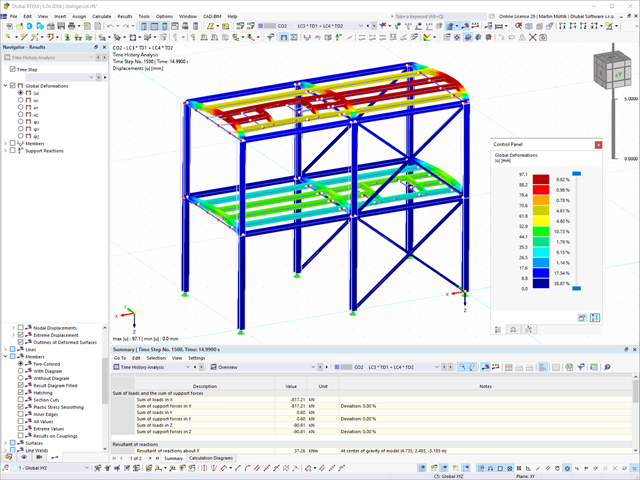
As soon as the program has completed the calculation, the summary of the results is listed. All result windows are integrated in the main program RFEM/RSTAB. You will find all the results arranged in tables; they can be displayed for each individual time step or as an envelope, and you also have the option of displaying the results graphically as well as animating them.
The results from the time history analysis can be displayed in the calculation diagrams. All the results are shown as a function of time. You can export the numeric values to MS Excel.
All result tables and graphics are part of the RFEM/RSTAB printout report. In this way, you can ensure clearly arranged documentation. You can also export the tables to MS Excel.
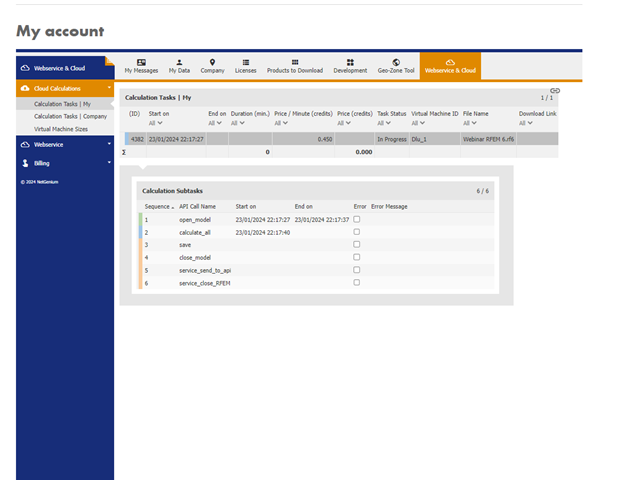
After completing the calculation, you will receive an email with a link to download the calculated file. Large files are compressed into a ZIP archive. Smaller files can be downloaded directly.
As an alternative, there is a link to the calculated file in the Extranet.
The downloaded file is a common RFEM file and can be used for further processing as usual.
- Calculation of deflections and comparison with the normative or manually adjusted limit values
- Consideration of a precamber for the deflection analysis
- Different limit values are possible, depending on the design situation type
- Manual Adjustment of Reference Lengths and Segmentation by Direction
- Calculation of deflections related to the initial structure or to the deformed structure
- Further detailed design checks depending on the selected design standard (for example, vibration design according to EN 1999‑1‑1, 7.2.3)
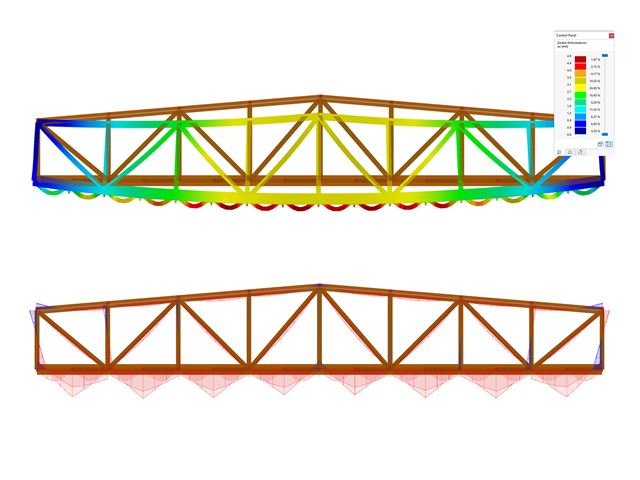
- Graphical result display integrated in RFEM/RSTAB; for example, the design ratio of a limit value, or the deformation or the sag
- Complete integration of the results into the RFEM/RSTAB printout report
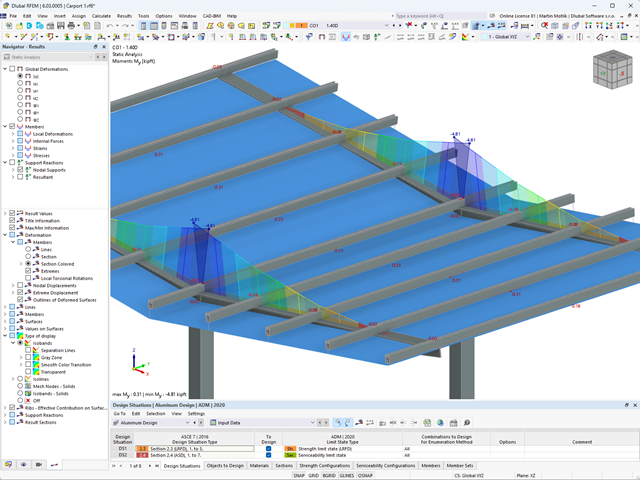
As usual, you enter the structural system and calculate the internal forces in the programs RFEM and RSTAB. You have unlimited access to the extensive material and cross-section libraries. Did you know that you can create general cross-sections using the RSECTION program? That saves you a lot of work.
Don't be afraid of additional windows and input chaos! Aluminum Design is completely integrated into the main programs and automatically takes into account the structure and the available calculation results. You can directly assign further entries for the aluminum design, such as effective lengths, cross-section reductions, or design parameters, to the objects to be designed. You can simply and efficiently select the elements graphically using the [Select] function.
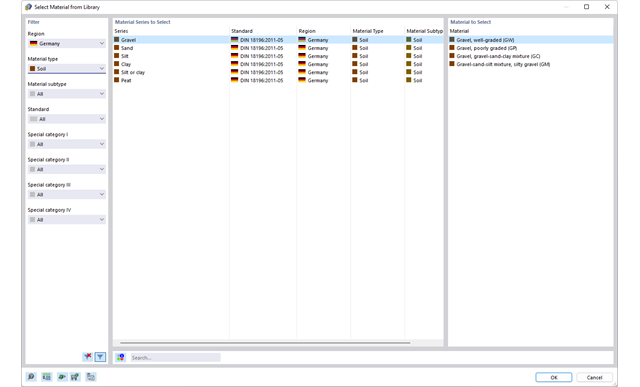
Enter and model a soil solid directly in RFEM. You can combine the soil material models with all common RFEM add-ons.
This allows you to easily analyze the entire models with a complete representation of the soil-structure interaction.
All parameters required for the calculation are automatically determined from the material data that you have entered. The program then generates the stress-strain curves for each FE element.
.png?mw=640&hash=8b43c740f4a91092df759928a6ee21f06f78f8cc)
The calculation of masonry is carried out in compliance with the nonlinear-plastic material law. If the load at any point is higher than the possible load to be resisted, redistribution takes place within the system. This have the simple purpose of restoring the equilibrium of forces. With the successful completion of the calculation, the stability analysis is provided.
- Arbitrary definition of the charring time
- Option to calculate with or without adhesion of the layer for surface structures (cross-laminated timber)
- Free user-defined specification of the fire parameters
- Consideration of Different Effective Lengths in Fire Resistance Design
- Optional design "Compression perpendicular to grain"
- Graphical result display integrated in RFEM/RSTAB, such as a design ratio
- Complete integration of the results into the RFEM/RSTAB printout report
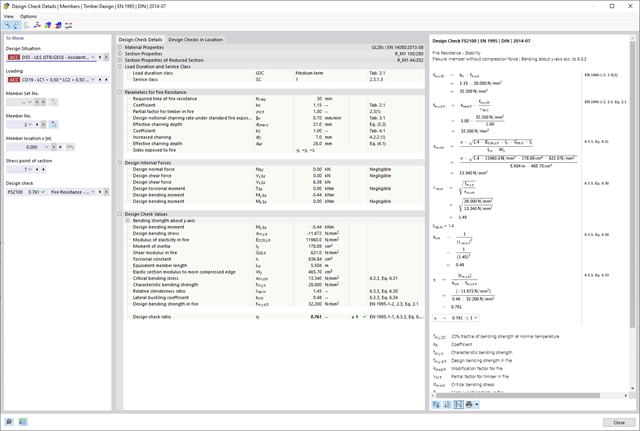
As you probably know, the design checks for the selected members are carried out, taking into account the defined charring time. All necessary reduction factors and coefficients are stored accordingly in the program and are taken into account when determining the load-bearing capacity. That saves you a lot of work.
The effective lengths for the equivalent member design are taken directly from the strength entries. You do not have to enter them again.
After completing the design, the program presents the fire resistance design checks clearly and with all result details. This allows you to follow the results completely transparently. The results also contain all the required parameters, so you can determine the component temperature at the design time.
In addition to all these features, the program allows you to integrate all result tables and graphics, including the ultimate and serviceability limit state results,into the global printout report of RFEM/RSTAB as a part of the steel design results.
You can enter the structural system and calculate the internal forces in the programs RFEM and RSTAB. You have full access to the extensive material and cross-section libraries.
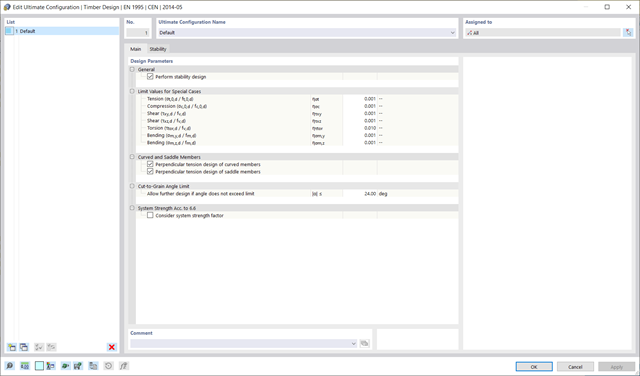
Timber Design is completely integrated into the main programs. At the same time, it automatically takes into account the structure and the available calculation results. You can assign further entries for the timber design, such as effective lengths, cross-section reductions, or design parameters, to the objects to be designed. You can easily select the elements graphically using the [Select] function at many places of the program.
- Calculation of deflections and comparison with the normative or manually adjusted limit values
- Consideration of a precamber for the deflection analysis
- Different limit values are possible, depending on the design situation type
- Manual adjustment of reference lengths and segmentation by direction
- Calculation of deflections related to the initial structure or to the deformed structure
- Automatic consideration of time-dependent deformations by increasing the load with the creep factor (can also be user-defined on the stiffness side)
- Simplified vibration design
- Graphical result display integrated in RFEM/RSTAB; for example, the design ratio of a limit value, the deformation, or the sag
- Complete integration of the results into the RFEM/RSTAB printout report
- Calculation of deflections and comparison with the normative or manually adjusted limit values
- Consideration of a precamber for the deflection analysis
- Different limit values are possible, depending on the design situation type
- Manual adjustment of reference lengths and segmentation by direction
- Calculation of deflections related to the initial structure or to the deformed structure
- Further detailed design checks depending on the selected design standard (for example, limitation of web breathing according to EN 1993‑2)
- Graphical result display integrated in RFEM/RSTAB; for example, the design ratio of a limit value, the deformation, or the sag
- Complete integration of the results into the RFEM/RSTAB printout report
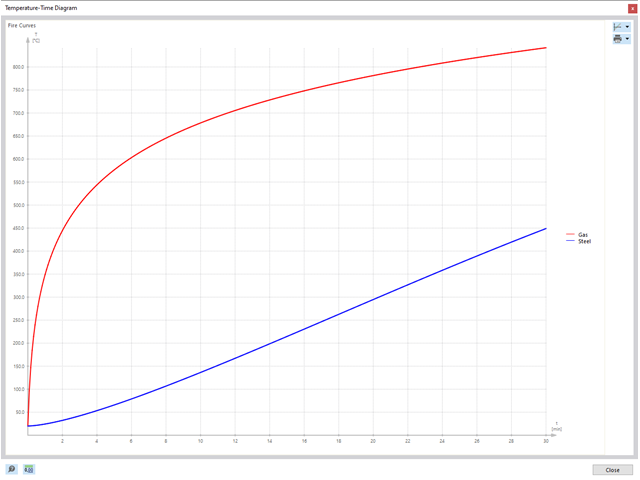
After completing the design, the Dlubal Software presents the fire resistance design checks clearly and with all result details. This makes the results comprehensible in detail. Furthermore, the results also contain all the parameters required for the determination of the component temperature at the design time.
You can also specifically evaluate the temperature distribution in the structural component using the temperature-time diagram.
All result tables and graphics, including the ultimate and serviceability limit state results, can be integrated into the global printout report of RFEM/RSTAB as a part of the steel design results.
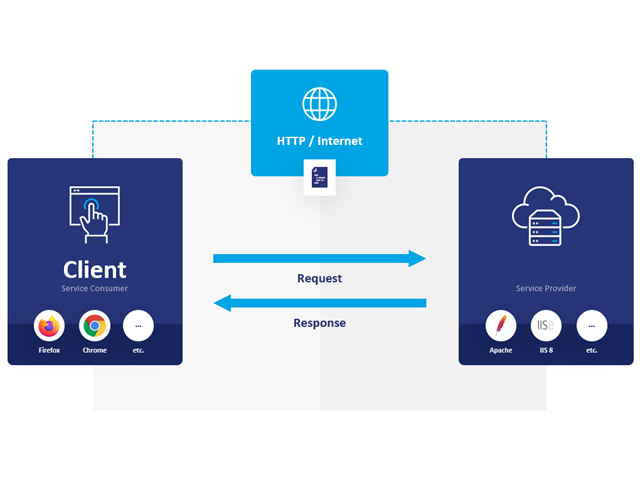
WebService and API provide you various scope of application. We have summarized some ideas as to how WebService and API can support your company:
- Creating additional applications for RFEM 6, RSTAB 9, and RSECTION 1
- Possibility to make the workflows more efficient (for example, model definition and input) and to integrate RFEM 6, RSTAB 9, and RSECTION 1 into your company applications
- Simulating and calculating several design options
- Running optimization algorithms for size, shape, and/or topology
- Accessing the calculation results
- Generation of printout reports in the PDF format
The level of quality of the work is automatically increased not only by the algorithmic model definitions, but also by:
- Extending / consolidating RFEM 6, RSTAB 9, and RSECTION 1 with your own controls
- Increased interoperability between the individual software used to complete a project
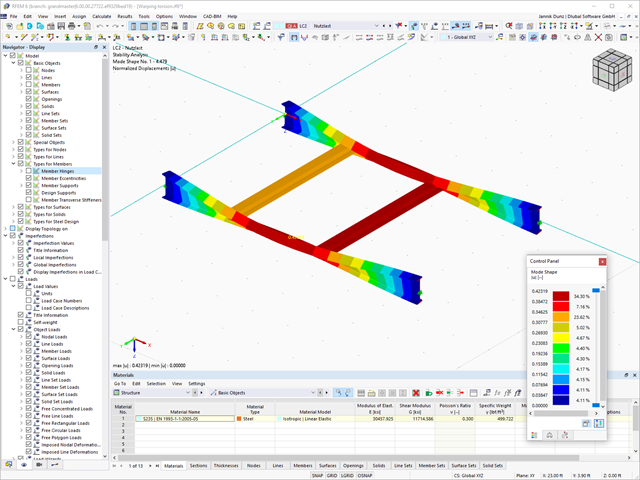
Compared to the RF-/STEEL Warping Torsion add-on module (RFEM 5 / RSTAB 8), the following new features have been added to the Torsional Warping (7 DOF) add-on for RFEM 6 / RSTAB 9:
- Complete integration into the environment of RFEM 6 and RSTAB 9
- 7th degree of freedom is directly taken into account in the calculation of members in RFEM/RSTAB on the entire system
- No more need to define support conditions or spring stiffnesses for calculation on the simplified equivalent system
- Combination with other add-ons is possible, for example for the calculation of critical loads for torsional buckling and lateral-torsional buckling with stability analysis
- No restriction to thin-walled steel sections (it is also possible to calculate ideal overturning moments for beams with massive timber sections, for example)
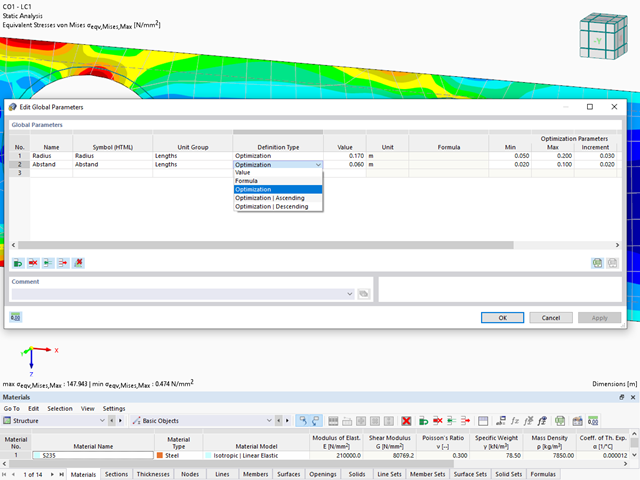
Did you know? The structural optimization in the programs RFEM and RSTAB is a completion of the parametric input. It is a parallel process beside the actual model calculation with all its regular calculation and design definitions. The add-on assumes that your model or block is built with a parametric context and is controlled in its entirety by global control parameters of the "optimization" type. Therefore, these control parameters have a lower and upper limit and a step size to delimit the optimization range. If you want to find optimal values for the control parameters, you have to specify an optimization criterion (for example, minimum weight) with the selection of an optimization method (for example, particle swarm optimization).
You can already find the cost and CO2 emission estimation in the material definitions. You can activate both options individually in each material definition. The estimation is based on a unit for unit cost or unit emission for members, surfaces, and solids. In this case, you can select whether to specify the units by weight, volume, or area.

Both optimization methods have one thing in common. At the end of the process, they provide you with a list of model mutations from the stored data. Here you can find the details of the controlling optimization result and the associated value assignment of the optimization parameters. This list is organized in descending order. You can find the assumed best solution shown in the first line. For this, the optimization result with its determined value assignment is closest to the optimization criterion. All add-on results have a utilization < 1. Furthermore, once the analysis is completed, the program will adjust the value assignment to that of the optimal solution for the optimization parameters in the global parameter list.
In the material dialog boxes, you can find the additional tabs "Cost Estimation" and "Estimation of CO2 Emissions". They show you the individual estimated sums of the assigned members, surfaces, and solids per unit weight, volume, and area. Furthermore, these tabs show the total cost and emission of all assigned materials. This gives you a good overview of your project.
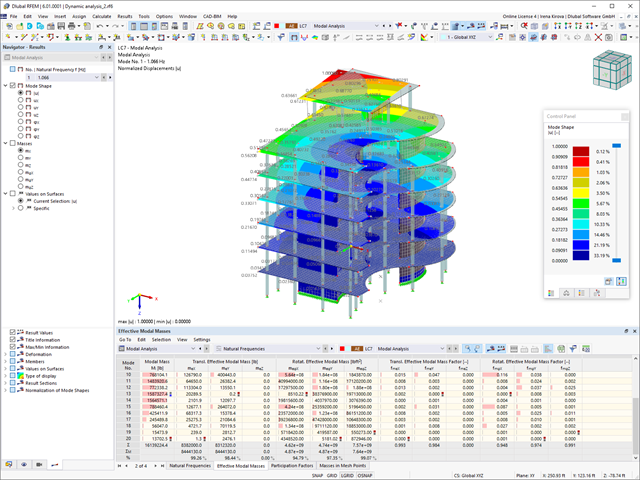
As soon as the program has completed the calculation, the eigenvalues, natural frequencies and periods are listed. These result windows are integrated in the main program RFEM/RSTAB. You can find all mode shapes of the structure in tables and also have an option to display them graphically and to animate them.
All result tables and graphics are part of the RFEM/RSTAB printout report. In this way, you can ensure clearly arranged documentation. You can also export the tables to MS Excel.
- Deformation analyses of reinforced concrete surfaces without or with cracks (state II) by applying the approximation method (for example, deformation analysis according to ACI 318-19, 24.3.2.5 or EN 1992‑1‑1, Cl. 7.4.3 )
- Tension stiffening of concrete applied between cracks
- Optional consideration of creep and shrinkage
- Graphical representation of results integrated in RFEM, such as deformation or sag of a flat slab
- Clear numerical result display in the detail dialog box
- Complete integration of results in the RFEM printout report
Have you carried out the design successfully? The results of the deformation analysis are now listed in clearly arranged output tables or detailed dialog boxes with info text. The program shows you all intermediate values in a comprehensible manner. Graphical representation of design ratios and deformation in RFEM allows you for a quick overview of critical areas.
Due to the results output of the design checks with all intermediate results, you can follow the calculation to the smallest detail. The complete integration of results in the RFEM printout report ensures that you obtain verifiable structural design.
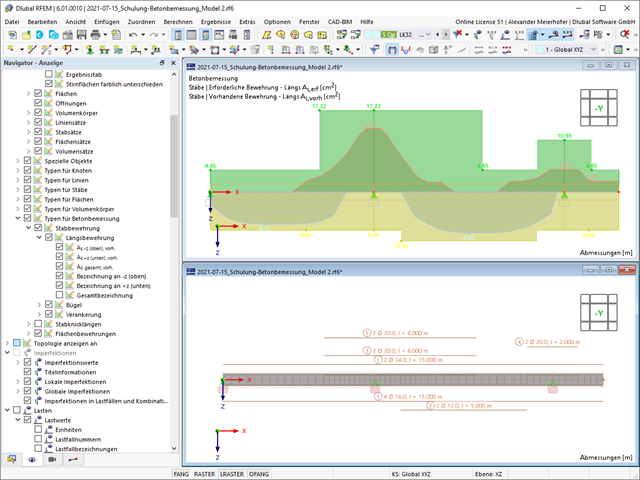
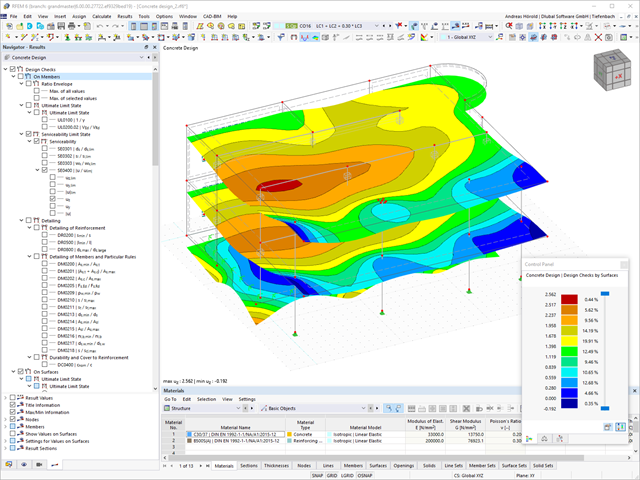
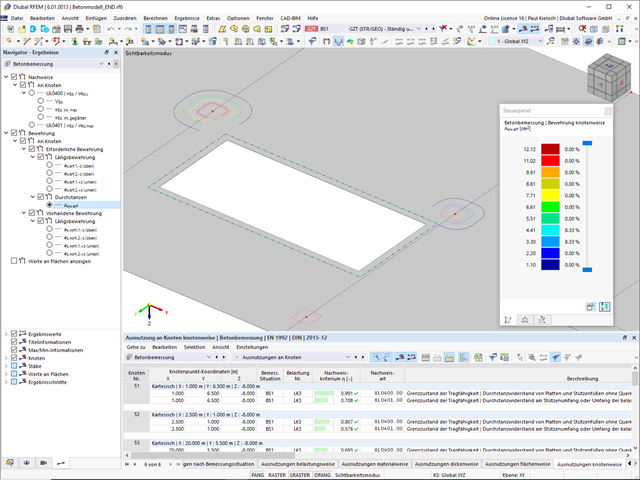
Is the design completed? Then you can lean back. The design ratios of the individual design checks (for example, ultimate limit state, serviceability limit state, or compliance with the construction rules) are displayed for you in a table. You can also find the required reinforcement listed in clearly arranged output tables. The program shows you all intermediate values in a comprehensible manner.
You can display the results of members as result diagrams on the respective member. Furthermore, you have the option to document the inserted reinforcement for longitudinal and stirrup reinforcement, including sketches, in accordance with current practice.
Select whether you want to display the results of surfaces as isolines, isosurfaces, or numerical values. In addition to the design check ratios, you can display the longitudinal reinforcement according to required, provided, and not covered reinforcement.
- Import of relevant information and results from RFEM
- Integrated, editable material and section library
- Sensible and complete presetting of input parameters
- Punching design on columns (all section shapes), wall ends, and wall corners
- Automatic recognition of the punching node position from an RFEM model
- Detection of curves or splines as a boundary of the control perimeter
- Automatic consideration of all slab openings defined in the RFEM model
- Construction and graphical display of the control perimeter
- Optional design with unsmoothed shear stress along the control perimeter that corresponds to the actual shear stress distribution in the FE model
- Determination of the load increment factor β via full-plastic shear distribution as constant factors according to EN 1992‑1‑1, Sect. 6.4.3 (3), based on EN 1992‑1‑1, Fig. 6.21N, or by a user‑defined specification
- Numerical and graphical display of results (3D, 2D, and in sections)
- Punching design of the slab without punching reinforcement
- Qualitative determination of the required punching reinforcement
- Design and analysis of the longitudinal reinforcement
- Complete integration of results in an RFEM printout report
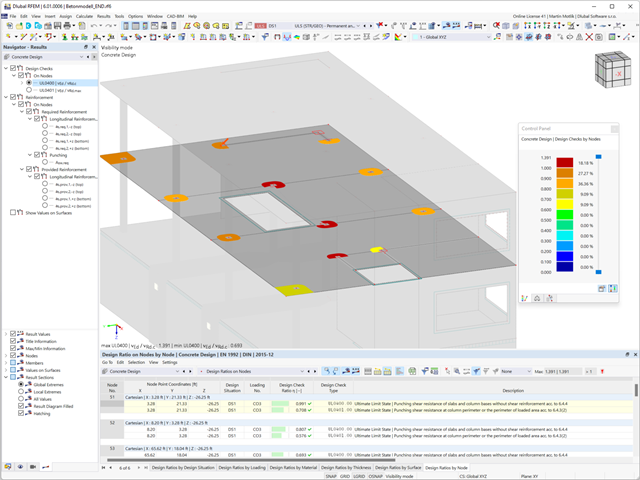
Is the design completed? Then sit back. Because the punching checks are presented for you clearly and with all result details. This allows you to precisely follow each result. The program shows you the provided and allowable shear stresses for the shear resistance of the slab in detail.
RFEM has even more to offer in this add-on. In the next result window, it lists the required longitudinal or punching reinforcement of each analyzed node. You can also find an explanatory graphic there. RFEM shows you the design results clearly displayed with values in the work window. You can integrate all result tables and graphics into the global printout report of RFEM. Thus, you can be sure of a clear documentation.
Did you know? When unloading the structural component with a plastic material model, in contrast to the Isotropic | Nonlinear Elastic material model, the strain remains after it has been completely unloaded.
You can select three different definition types:
- Standard (definition of the equivalent stress under which the material plastifies)
- Bilinear (definition of the equivalent stress and strain hardening modulus)
- Stress-strain diagram: definition of polygonal stress-strain diagram
- Option to save / import the diagram
- Interface with MS Excel
- General stress analysis
- Automatic import of internal forces from RFEM/RSTAB
- Graphical and numerical output of stresses, strains, clearance, and design ratios fully integrated in RFEM/RSTAB
- User-defined specification of the limit stress
- Summary of similar structural components for the design
- Wide range of customization options for graphical output
- Clearly arranged result tables for a quick overview after the design
- Simple traceability of the results due to the complete documentation of the calculation method including all formulas
- High productivity due to the minimal amount of input data required
- Flexibility due to detailed setting options for basis and extent of calculations
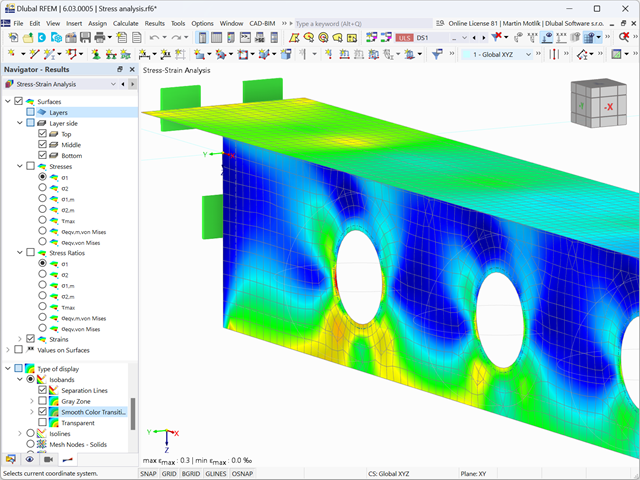
- Gray zone display for unimportant value ranges (see Product Feature)

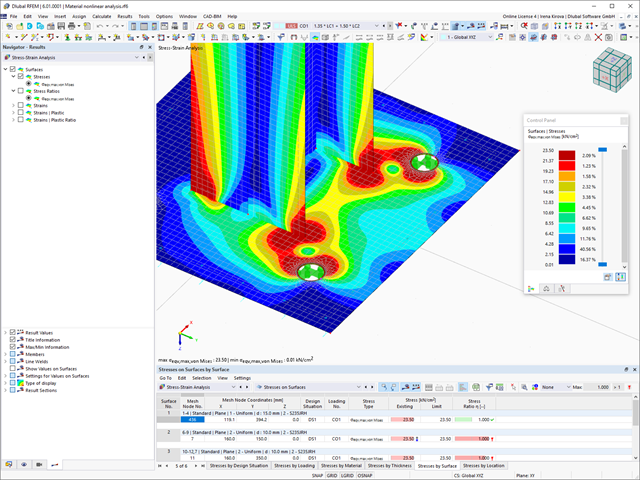
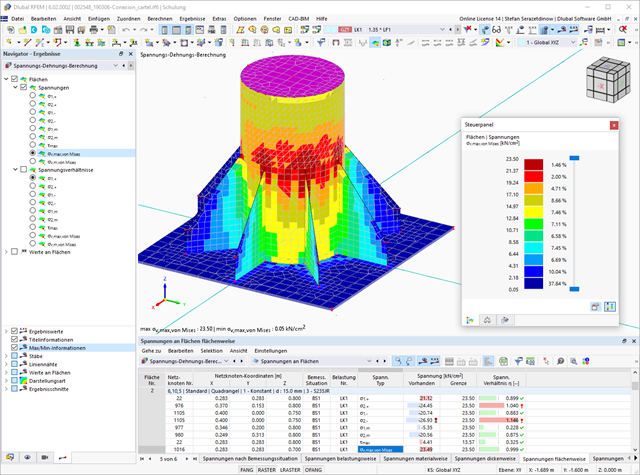
After you have completed the design, the program takes care of clearly arranged results. Thus, the program shows you the resulting maximum stresses and stress ratios sorted by section, member/surface, solid, member set, x-location, and so on. In addition to the tabular result values, the add-on shows you the corresponding cross-section graphic with stress points, stress diagram, and values as well. You can relate the design ratio to any kind of stress type. The current location is highlighted in the RFEM/RSTAB model.
In addition to the tabular evaluation, the program offers you even more. You can also graphically check the stresses and design ratios on the RFEM/RSTAB model. It is possible for you to adjust the colors and values individually.
The display of result diagrams of a member or set of members enables you a targeted evaluation. For each design location, you can open the respective dialog box to check the design-relevant section properties and stress components of any stress point. Finally, you have the option of printing the corresponding graphic, including all design details.
If you release a structural component with a nonlinear elastic material again, the strain goes back on the same path. In contrast to the Isotropic|Plastic material model, there is no strain left when completely unloaded.
You can select three different definition types:
- Standard (definition of the equivalent stress under which the material plastifies)
- Bilinear (definition of the equivalent stress and strain hardening modulus)
- Stress-Strain Diagram:
- Definition of polygonal stress-strain diagram
- Option to save / import the diagram
- Interface with MS Excel
Background information about nonlinear material models can be found in the technical article describing the yield laws in isotropic nonlinear elastic material model.
_(2).png?mw=640&hash=0414bfe44045fc798e3774a0173332ca37424418)
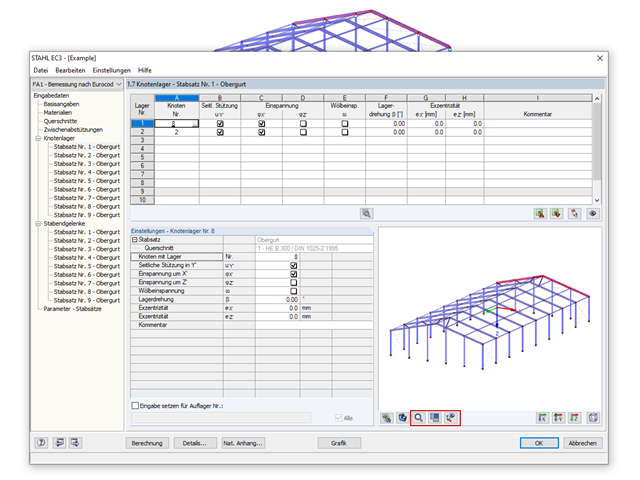
General
- Beam to Column joint category: connection possible as joint of the beam to the column flange as well as joint of the column to the girder flange
- Beam to Beam joint category: design of beam joints as both moment-resisting end plate connections and rigid splice connections possible
- Automatic export of model and load data possible from RFEM or RSTAB
- Bolt sizes from M12 to M36 with strength grades 4.6, 4.8, 5.6, 5.8, 6.8, 8.8, and 10.9 as long as the strength grades are available in the selected National Annex
- Almost any bolt spacing and edge distances (a check of the allowable distances is performed)
- Beam strengthening with tapers or stiffeners on the top and bottom surfaces
- End plate connection with and without overlap
- Connection with pure bending stress, pure normal force load (tension joint), or combination of normal force and bending possible
- Calculation of connection stiffnesses and check if a hinged, semi-rigid, or rigid connection exists
End plate connection in a beam-column setup
- Joint beams or columns can be stiffened with tapers on one side or with stiffeners to one or both sides
- Wide range of possible stiffeners of the connection (for example, complete or incomplete web stiffeners)
- Up to ten horizontal and four vertical bolts possible
- Connected object possible as constant or tapered I-section
- Designs:
- Ultimate limit state of the connected beam (such as shear or tension resistance of the web plate)
- Ultimate limit state of the end plate at the beam (for example, T-stub under tensile stress)
- Ultimate limit state of the welds at the end plate
- Ultimate limit state of the column in the area of the connection (for example, column flange under bending – T-stub)
- All designs are performed according to EN 1993-1-8 and EN 1993-1-1
Moment-resisting end plate joint
- Two or four vertical and up to 10 horizontal bolt rows
- Joint beams can be stiffened with tapers on one side or with stiffeners to one or both sides
- Connected objects are possible as constant or tapered I-sections
- Designs:
- Ultimate limit state of the connected beams (such as shear or tension resistance of the web plates)
- Ultimate limit state of the end plates at the beam (for example, T-stub under tensile stress)
- Ultimate limit state of the welds at the end plates
- Ultimate limit state of the bolts in the end plate (combination of tension and shear)
Rigid splice plate connection
- For the flange plate connection, up to ten bolt rows one behind the other possible
- For the web plate connection, up to ten bolt rows possible each in vertical and horizontal directions
- Material of the cleat can be different from the one of the beams
- Designs:
- Ultimate limit state of the joint beams (for example, net cross-section in the tension area)
- Ultimate limit state of the cleat plates (for example, net cross-section under tensile stress)
- Ultimate limit state of the single bolts and the bolt groups (for example, shear resistance design of the single bolt)
- General stress analysis
- Automatic import of internal forces from RFEM/RSTAB
- Complete graphical and numerical results of stresses and stress ratios integrated in RFEM/RSTAB
- Wide range of customization options for graphical output
- Flexible design in multiple design cases
- Clearly arranged result tables for a quick overview after the design
- High productivity due to the minimal amount of input data required
- Flexibility due to detailed setting options for basis and extent of calculations
.png?mw=640&hash=688fdfc8af4828c08e9851cddb103a1e86cb899a)
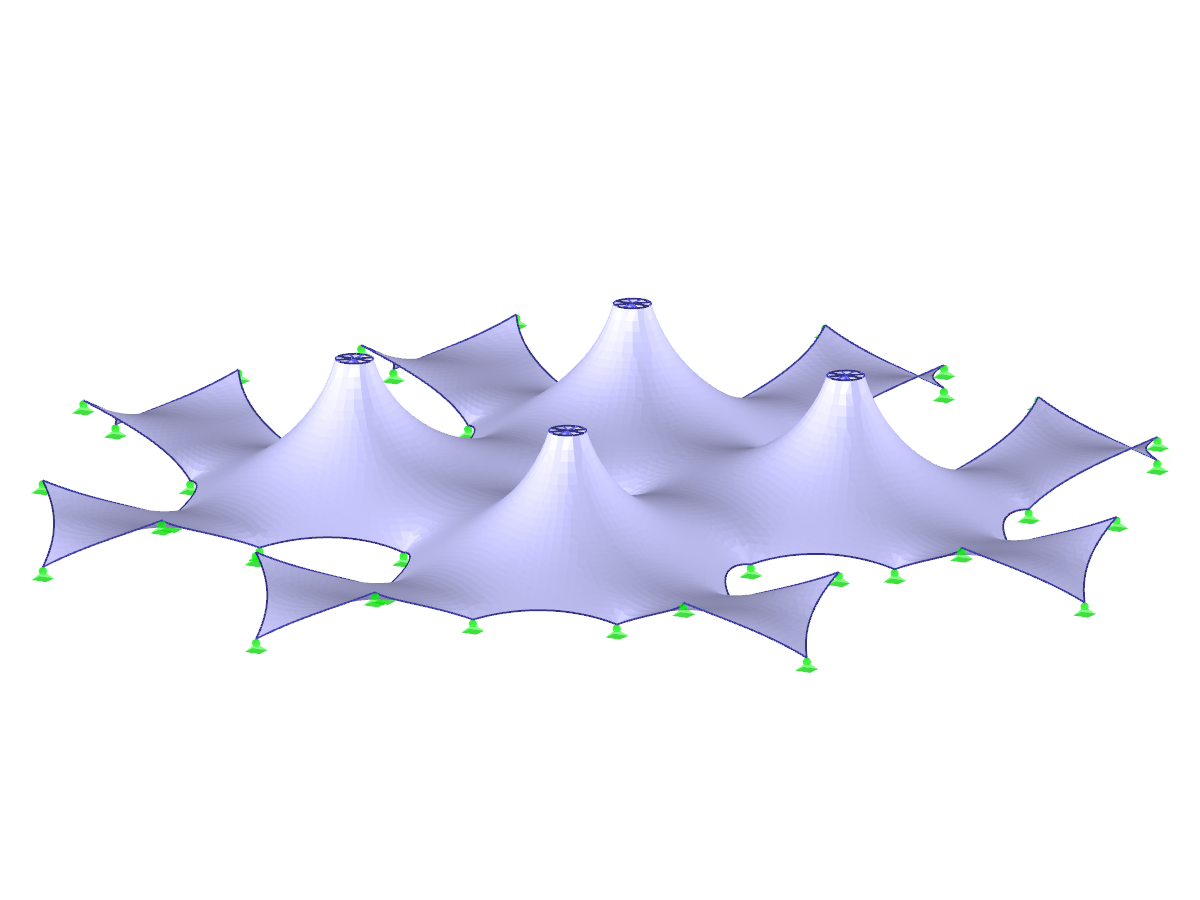
- Form-finding of:
- tension-loaded membrane and cable structures
- compression-loaded shell and beam structures
- mixed tension- and compression-loaded structures
- Consideration of gas chambers between surfaces
- Interaction with supporting structure (substructure design according to various standards)
- Surfaces as a 2D and members as a 1D element
- Definition of different prestress conditions for surfaces (membranes and shells)
- Definition of forces or geometrical requirements for members (cables and beams)
- Consideration of individual loads (self‑weight, inner pressure, and so on) in the form‑finding process
- Temporary support definitions for the form-finding process
- Automatic preliminary form-finding of membrane surfaces (more information...)
- Definition of isotropic or orthotropic material for structural analysis
- Optional definition of free polygon loads
- Transformation of form‑found shape elements into NURBS surface elements
- Possibility of combined form-finding by integration of preliminary form-finding
- Graphical evaluation of the new form using colored coordinates and inclination plots
- Complete documentation of the calculation including user-defined adaptive evaluation figures
- Optional export of the FE mesh as a DXF or Excel file
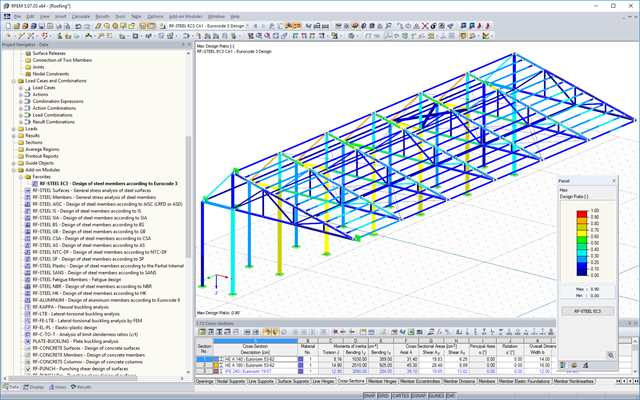
The results sorted by load case, cross-section, member, set of members, or x-location are displayed in clearly arranged result windows. By selecting the corresponding table row, detailed information about the performed design is displayed.
The results include a comprehensible list of all material and cross-section properties, design internal forces, and design factors. Furthermore, it is possible to display the distribution of internal forces of each x-location in a separate graphic window.
Parts lists by members/sets of members for the individual cross-section types complete the detailed and structured display of results. To print input data and results, you can use the global printout report in RFEM/RSTAB.
For further processing of various data, it is possible to export all tables to MS Excel.