Flexural Buckling Curves According to EN 1993-1-1, Table 6.2
The buckling lines in the standard indicate the reduction factor χ to be used, depending on the related slenderness ratio λ ̅. This reduction of the load-bearing capacity takes into account the influence of the geometric and structural imperfections on the component stiffness. These are included in the calculation formula of the reduction factor via imperfection factor α.
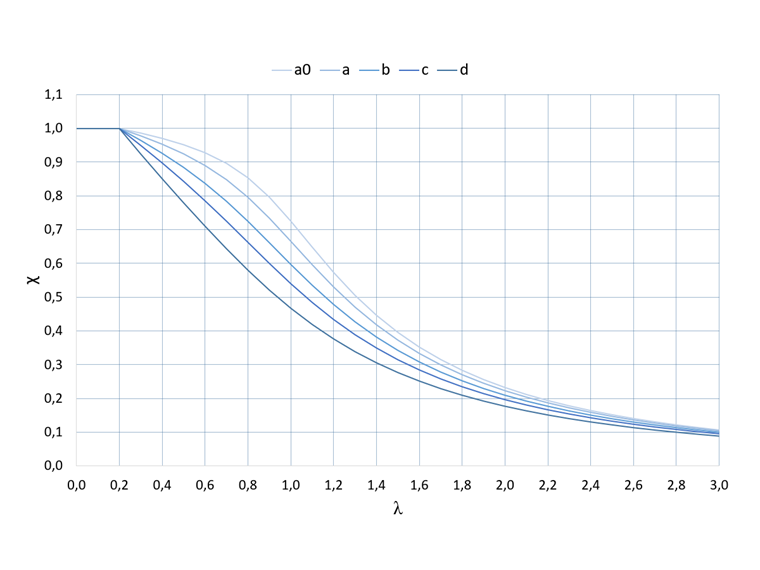
The most favorable buckling line a0 represents the least influence of the imperfections and thus provides a higher flexural buckling resistance with the same slenderness. The most unfavorable buckling curve with the largest imperfection factor is buckling curve d.
| Imperfection Coefficients According to EN 1993-1-1, Table 6.1 | |||||
|---|---|---|---|---|---|
| Buckling Curve | a0 | a | b | c | d |
| Imperfection Factor α | 0.13 | 0.21 | 0.34 | 0.49 | 0.76 |
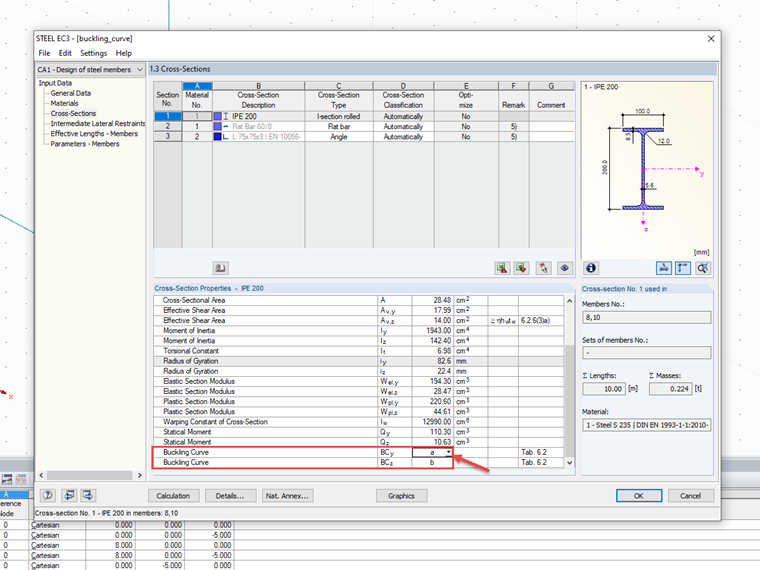
Manual Adjustment in RF-/STEEL EC3
In the input window of the cross-sections, the cross-section details are displayed again in the add-on module. For each cross-section, you can select the buckling curve differently from the database value in the detail settings.