


In RFEM, it is possible to determine a pushover curve or a capacity curve and export it to Excel. In the following, you can find a list of the steps that must be performed:
Definition of Nonlinear Hinges
- Plastic hinge according to FEMA 356: A nonlinear hinge (elastic-plastic or rigid-plastic) with the preset yield values and acceptance criteria for steel members (Chapter 5 of FEMA 356). The yield strength values depend on the member and are preset automatically. The diagram parameters are interpolated, depending on the cross-section type. The "FEMA" hinges can be customized.
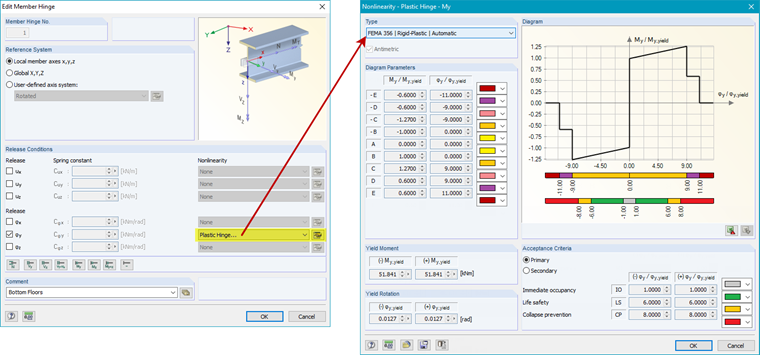
- Plastic hinge according to EN 1998‑3: Bilinear definition of the yield curve. The bilinear hinges also have preset yield values, acceptance criteria, and yield limits, but can be adjusted manually. The advantage of using the plastic hinges is that the hinges are displayed in color when evaluating the individual load steps. Thus, it is possible to quickly detect the exceeding of an acceptance criterion, for example.
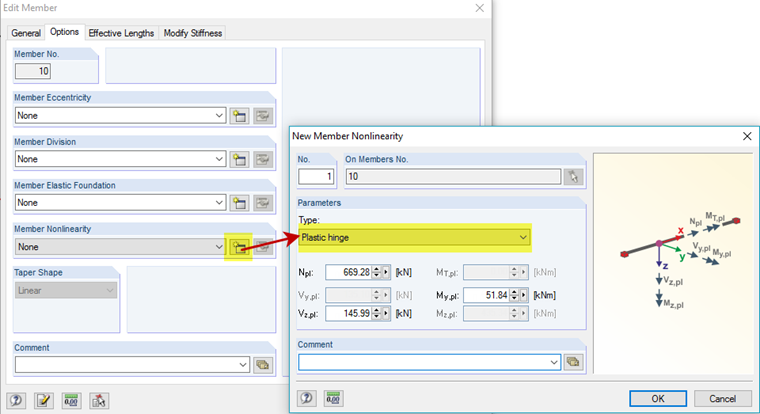
- As an alternative to the definition of a hinge, RFEM provides the "Plastic Hinge" member nonlinearity. You can define perfectly plastic behavior here; you have to enter the plastic limit values manually. The advantage of this option is that the location of the created plastic hinge is found automatically.
Definition of Load Patterns for Nonlinear Analysis
This can be done manually by entering loads into a load case; for example, a uniformly distributed load over the building height.
A load distribution similar to the mode shape distribution can be generated automatically with the RF‑DYNAM Pro – Equivalent Loads add-on module. This module determines eigenvalues and equivalent loads based on the response spectrum analysis. For each selected eigenvalue, equivalent loads are generated and exported to RFEM in load cases.
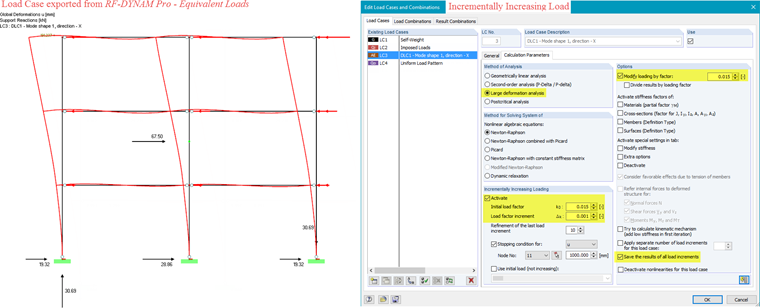
Load Increment in RFEM
A load increment can be defined in the calculation parameters of load cases. The results of all load increments can be analyzed. Especially when using the "Plastic Hinges", the plastic yielding can be evaluated easily by color-coding the hinges. It is important to scale the exported equivalent loads (from RF‑DYNAM Pro) so that the loads are not increased in overly large increments. Image 03 shows the load case exported from RF‑DYNAM Pro and the recommended calculation parameters.
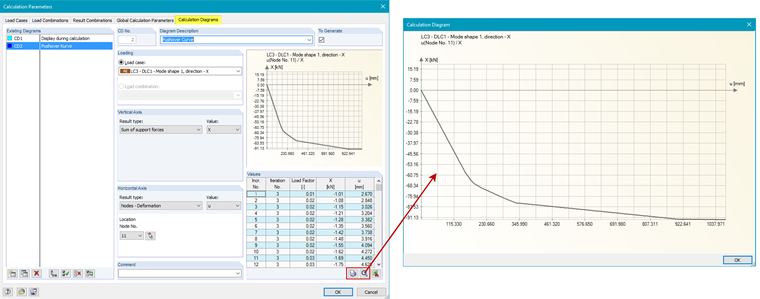
Calculation Diagrams to Create Pushover Curve
You can find them under "Global Calculation Parameters". You can define the total seismic load on the vertical axis and the deformation in the roof plane on the horizontal axis to obtain the desired pushover curve. You can easily export the data to Excel.
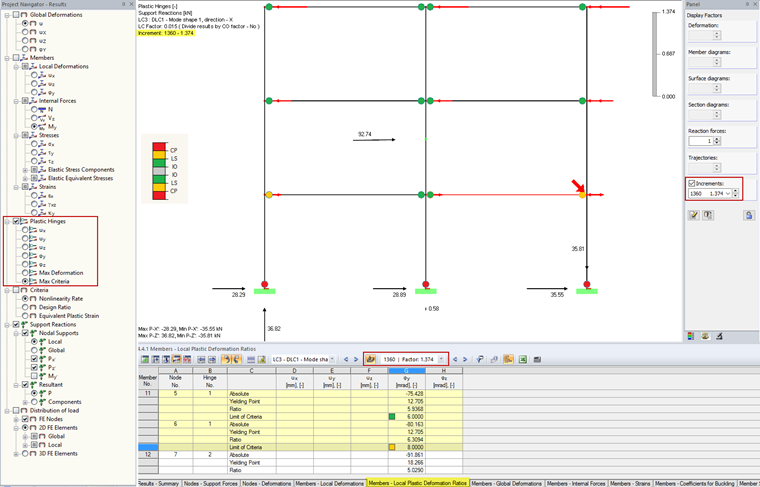
The color display of the plastic hinges is shown in Image 05. You can select the color scale according to the acceptance criteria or according to the defined parameters of the hinge diagram.
A further pushover analysis (determination of the inelastic spectrum, performance point) can then be performed, for example, in Excel.
In the download section below, you can find a detailed description of this tutorial within a PDF document (in English).