21 Results
View Results:
Sort by:
The data exchange between RFEM 6 and Allplan can be done using various file formats. This article describes the data exchange of a determined surface reinforcement using the ASF interface. This allows you to display the RFEM reinforcement values as level curves or colored reinforcement images in Allplan.
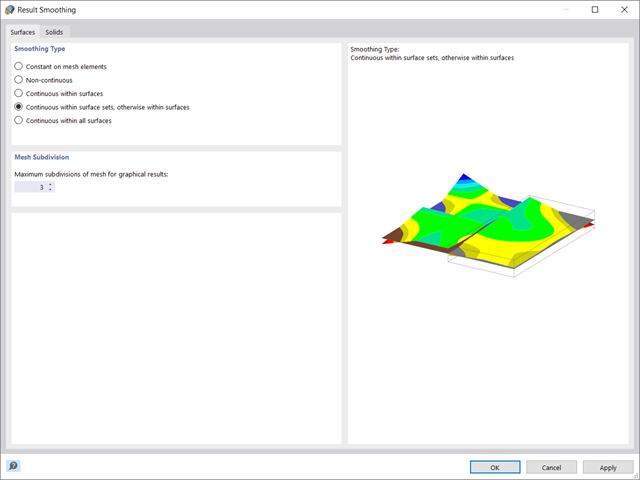
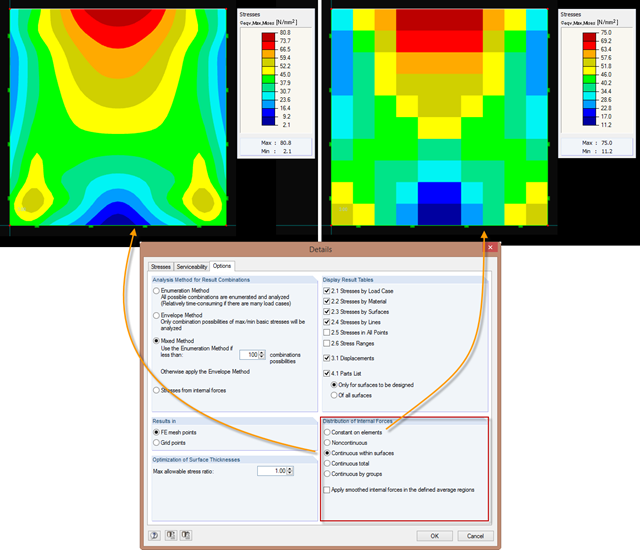
In RFEM 6, the results for the FE mesh nodes are determined using the finite element method. For the distribution of internal forces, deformations, and stresses to be continuous, these nodal values are smoothed through an interpolation process. This article will introduce and compare the different types of smoothing that you can use for this purpose.
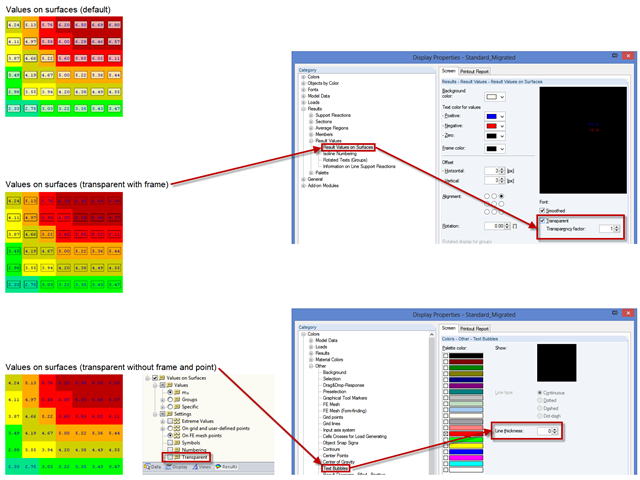
You can make various settings in order to achieve a clearly‑arranged display of the result values. For example, some users may not want the white background in text bubbles. You can adjust the background in "Display Properties" using the Transparent and Background color option.
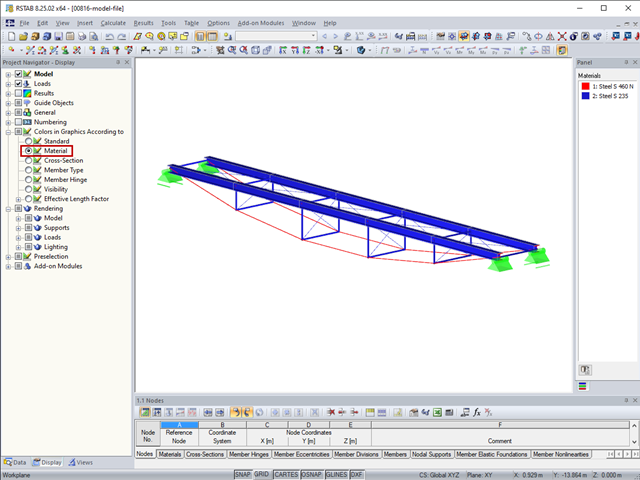
In RFEM and RSTAB, you can visually check or display the materials used for members in the wireframe and solid models.
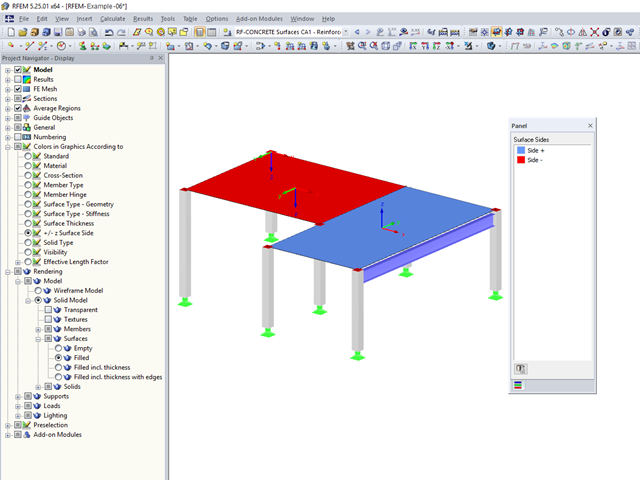
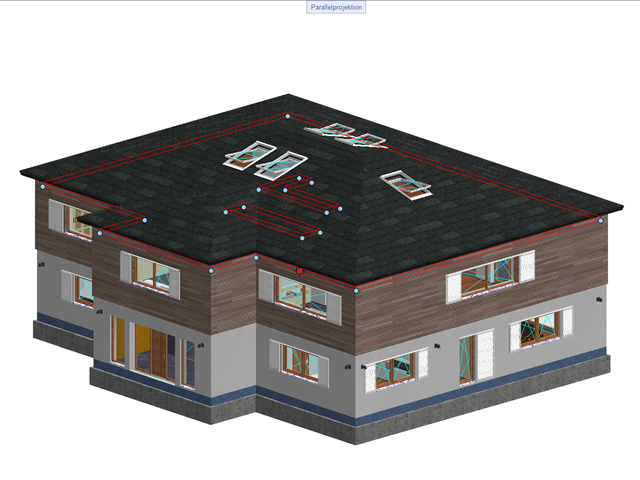
You can color the surfaces in the direction of the local z‑axis using the indicated option in the Display Navigator. By default, the side lying in the negative z-direction is colored red and the side lying in the positive z-direction is colored blue.
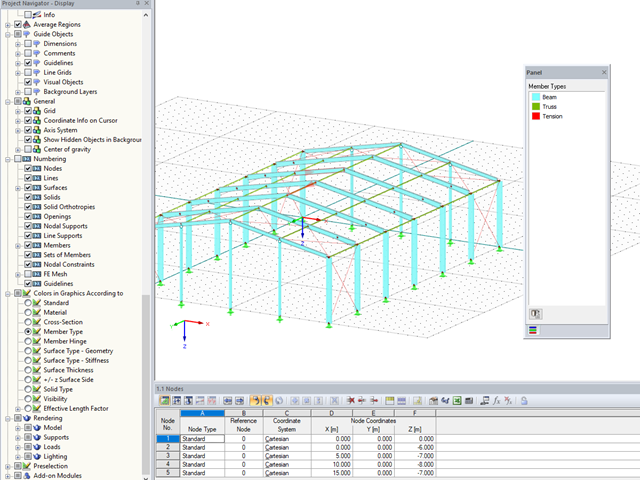
In RFEM and RSTAB, you can now also display and check the types of members used visually, by means of colors. To do this, an option has been integrated into the Display Navigator.
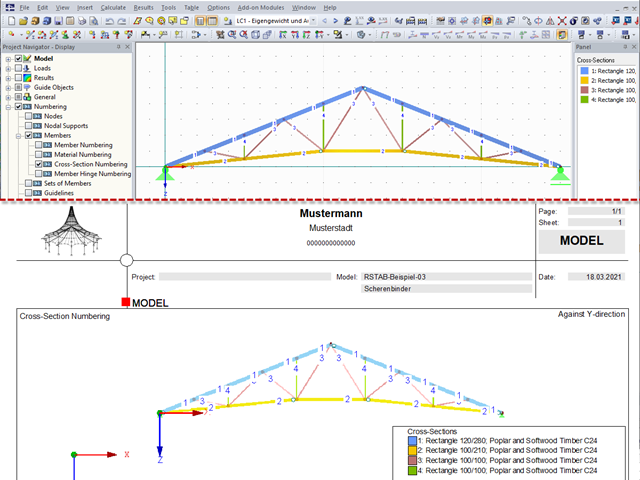
For a quick overview of the cross‑sections used, you can show the members in color sorted by cross‑section. Use the right mouse button in the work window to select "Colors in Graphics According to" → "Cross -Sections" from the shortcut menu. In the current program versions, you can use a panel with an editable color scale for this.
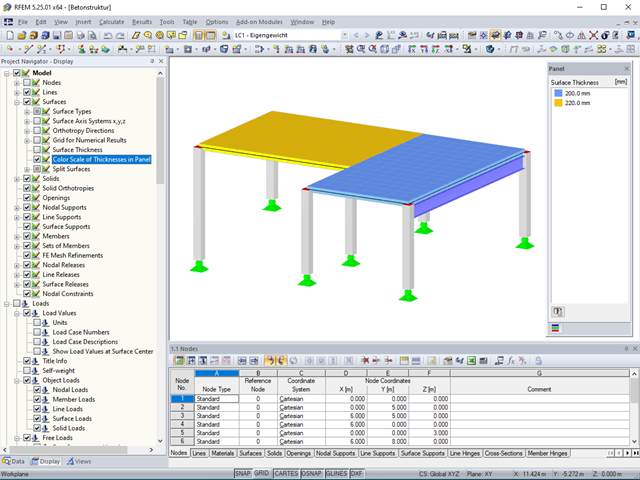
Surface thicknesses can be visualized in the model using various colors.
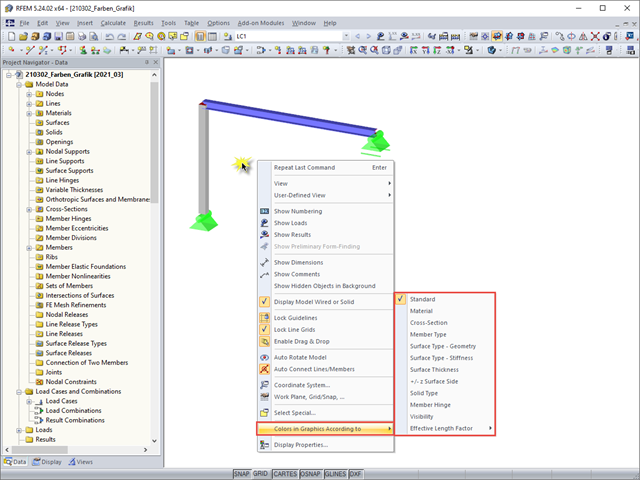
For a clearer display of the structure, you can display it in different colors. The corresponding selection can be opened by right-clicking the work window.
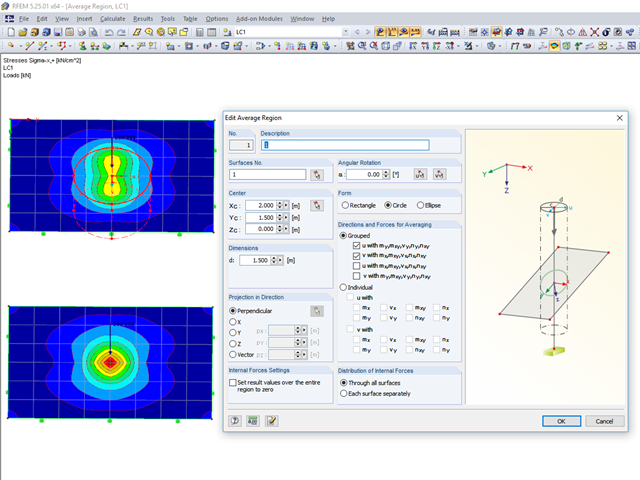
RFEM 5 provides the option to define a smoothing area in the "Results" → "New Average Region" menu. You can choose a rectangular, circular, or elliptical shape. With this tool you can, for example, "smooth" singularities due to nodal loads in a desired averaged region.
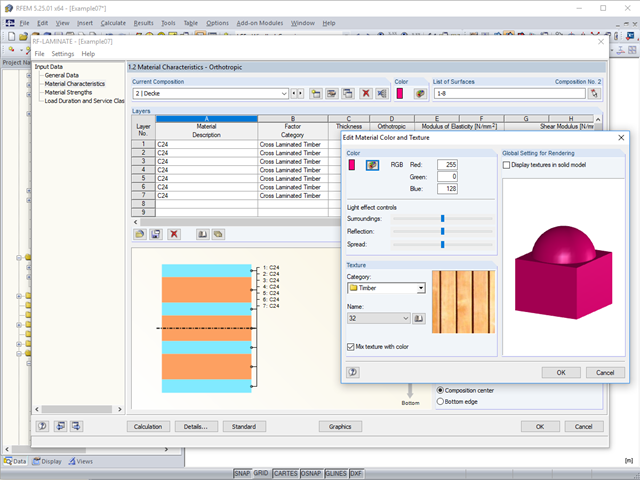
To better distinguish between the different layer compositions (for example, for walls and ceilings), you can assign user‑defined colors and textures to each composition.
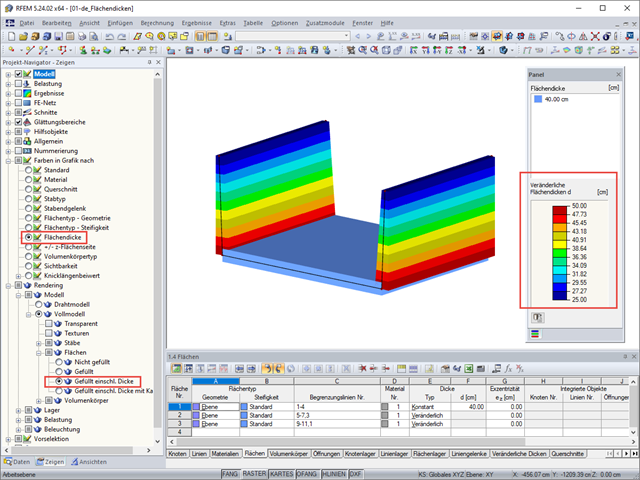
RFEM 5 allows you to show the variable surface thicknesses as a color gradient.
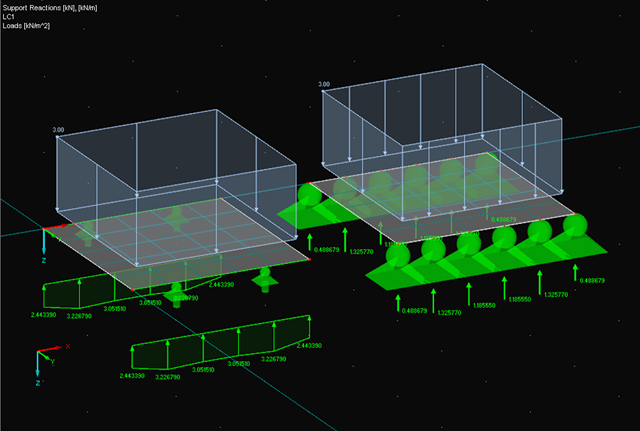
When evaluating line support forces, implausible diagrams sometimes arise at first glance. In particular, for variable loads at locations that also have a nodal support, at division points and edge locations of supported lines, the results sometimes show unexpected support reactions. Using the function of the linear smooth distribution in Project Navigator – Display does not always lead to the expected result diagram.
When calculating a surface model, the internal forces are determined separately for each finite element. Since the element-by-element results usually represent a discontinuous distribution, RFEM performs smoothing of the internal forces that takes into account the influence of adjacent elements. The discontinuous distribution of internal forces is adjusted with this method. The result evaluation is thus clearer and easier.
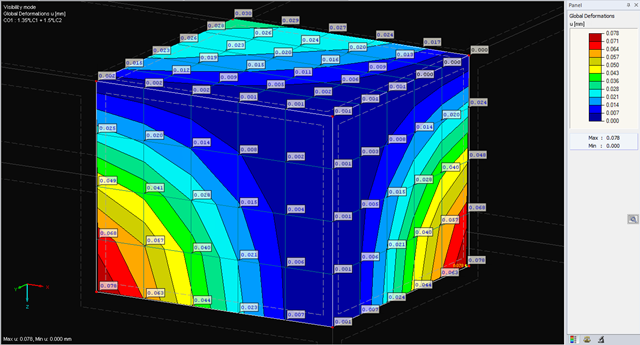
The deformations of the FE nodes are always the first result of an FE calculation. It is possible to calculate strains, internal forces, and stresses based on these deformations and the stiffness of the elements.
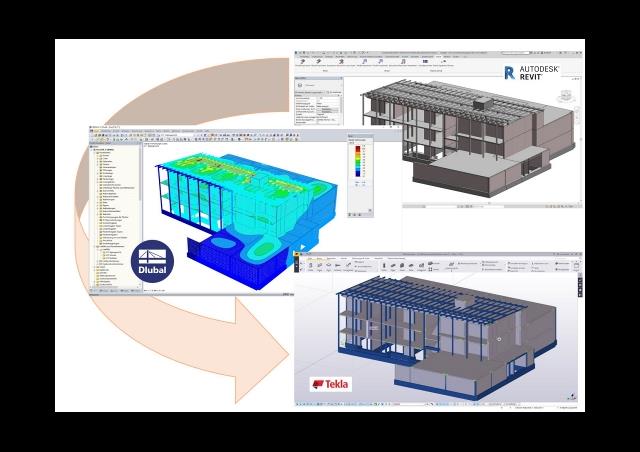
This article discusses the most common BIM interfaces. Adjustments are often necessary during the transition to the structural branch-specific model. The tasks that arise and the tools to address them successfully and quickly are presented.
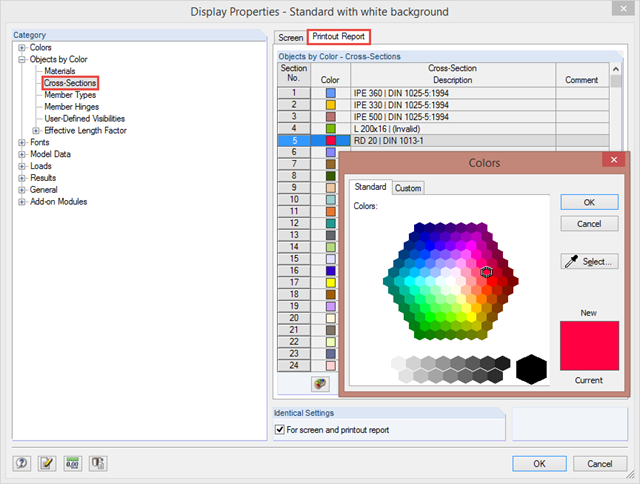
By clicking "Options" → "Display Properties" → "Edit", you can change and save display settings for printout reports and your screen. For example, you can set individual colors for cross‑sections.
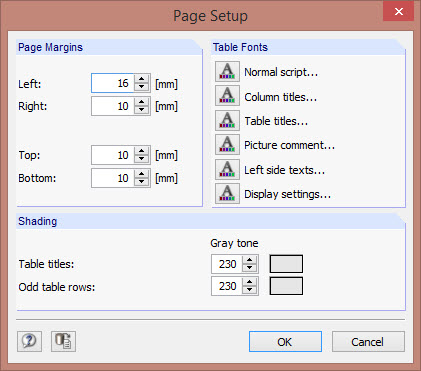
The layout of a printout report can be adjusted by changing fonts, font colors, page margins, and table shading.
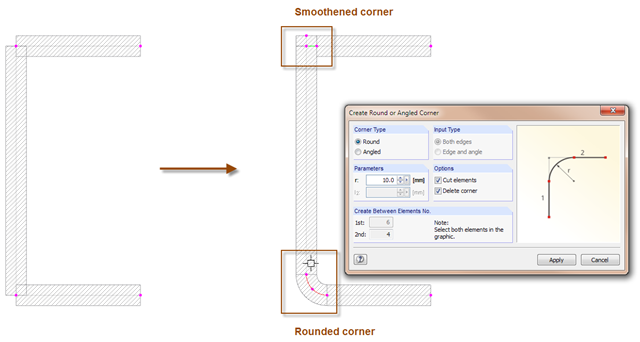
With the SHAPE-THIN cross-section program, you can model the corner areas of cross-sections in detail: The "Smooth Corner" function fills the corner with an element and automatically connects it with a null element. For this, simply click the corner. Use the "Create Round or Angled Corner" function to round or angle the corner. To do this, specify the fillet radius and click both elements.
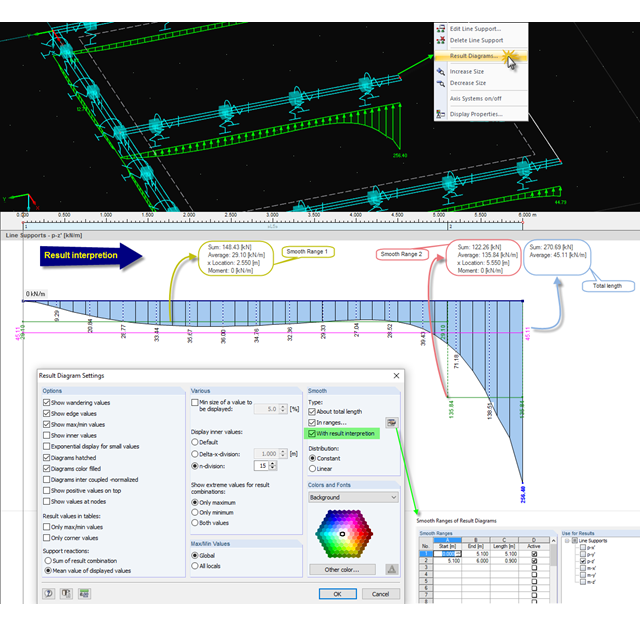
When evaluating results in the smooth state, you can display the average and sum values. This option is also available for parts of a line, a section, and so on. By importing the graphic into the printout report, you can document these values in the structural analysis.
Just as in the RFEM Display Navigator, you can set the distribution of internal forces in surfaces in RF‑STEEL Surfaces. Since deformations are always the result of the FEM calculation, the corresponding forces will be recalculated. This means that the internal forces on an FEM element are calculated depending on the composition (triangular or square) in three or four places. In order to obtain continuous internal forces and thus a smoothed distribution, these internal forces have to be interpolated. Interpolation is done by selecting the "Distribution of internal forces" option in the surfaces.