18 Results
View Results:
Sort by:
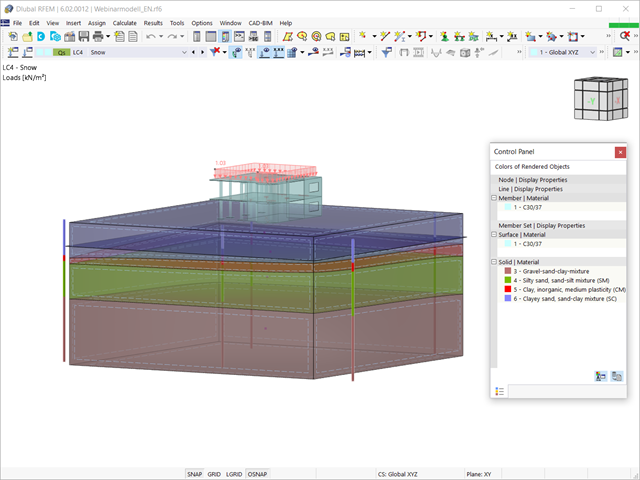
Given that realistic determination of the soil conditions significantly influences the quality of the structural analysis of buildings, the Geotechnical Analysis add-on is offered in RFEM 6 to determine the soil body to be analyzed.
The way to provide data obtained from field tests in the add-on and use the properties from soil samples to determine the soil massifs of interest was discussed in Knowledge Base article “Creation of the Soil Body from Soil Samples in RFEM 6”. This article, on the other hand, will discuss the procedure to calculate settlements and soil pressures for a reinforced concrete building.
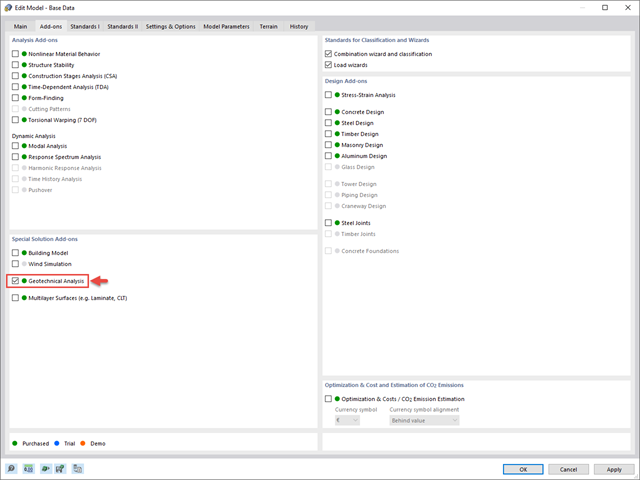
The quality of the structural analysis of buildings is significantly improved when the soil conditions are considered as realistically as possible. In RFEM 6, you can realistically determine the soil body to be analyzed with the help of the Geotechnical Analysis add-on. This add-on can be activated in the model’s Base Data as shown in Image 01.
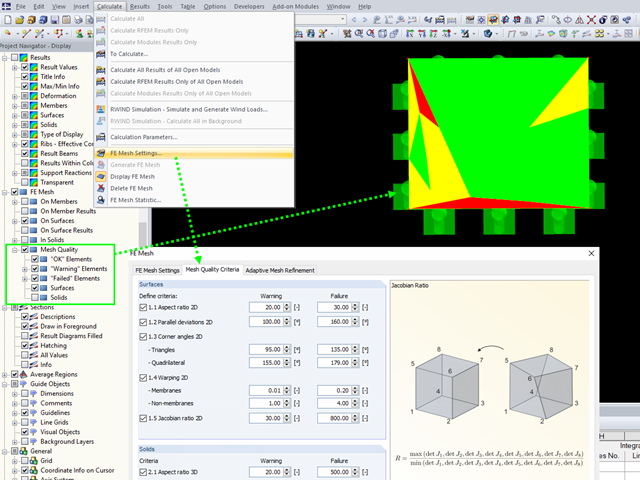
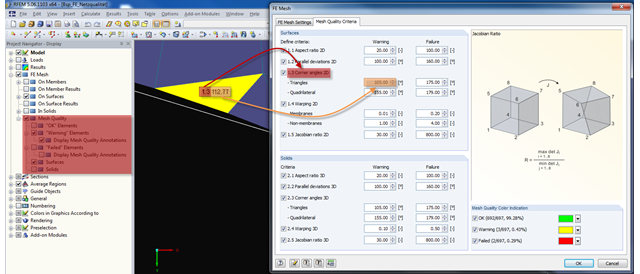
An FE mesh quality display is available in RFEM as a tool for structural analyses of two-dimensional components. It leads to the execution of an internal check of the generated finite elements for defined criteria.
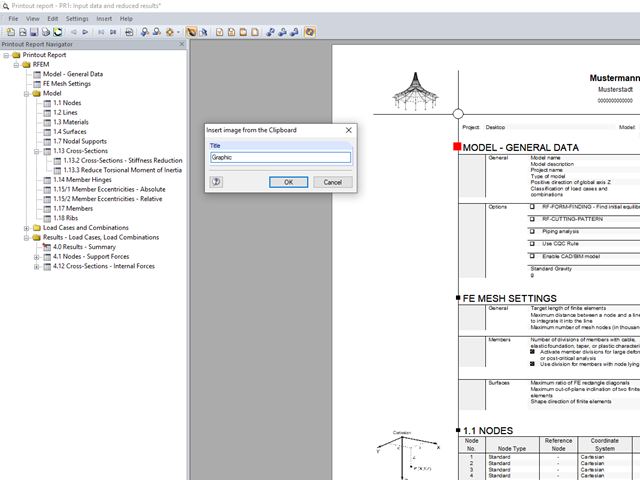
In RFEM and RSTAB, you can insert external images into the printout report.
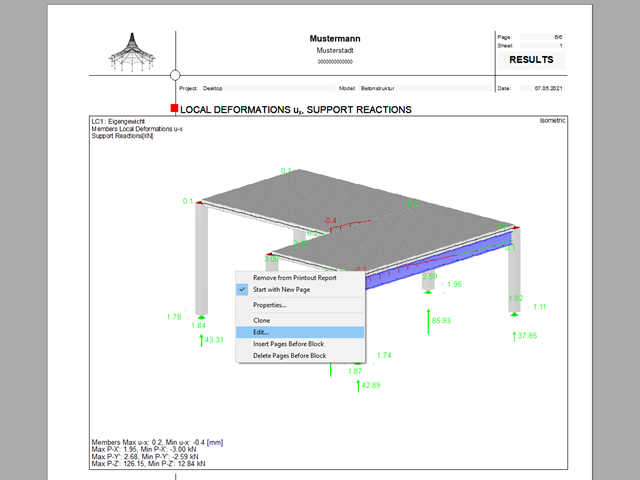
The printout report allows you to edit graphics subsequently.
- 000945
- Add-on Modules
- RF-FRAME-JOINT Pro 5
-
- JOINTS Steel | Column Base 8
- JOINTS Steel | DSTV 8
- JOINTS Steel | Pinned 8
- JOINTS Steel | Rigid 8
- JOINTS Steel | SIKLA 8
- JOINTS Steel | Tower 8
- JOINTS Timber | Steel to Timber 8
- JOINTS Timber | Timber to Timber 8
- RF-JOINTS Steel | SIKLA 5
- RF-JOINTS Steel | Column Base 5
- RF-JOINTS Steel | DSTV 5
- RF-JOINTS Steel | Pinned 5
- RF-JOINTS Steel | Rigid 5
- RF-JOINTS Steel | Tower 5
- RF-JOINTS Timber | Steel to Timber 5
- RF-JOINTS Timber | Timber to Timber 5
- FRAME-JOINT Pro 8
- Steel Structures
- Timber Structures
- Steel Connections
- Eurocode 3
- Eurocode 5
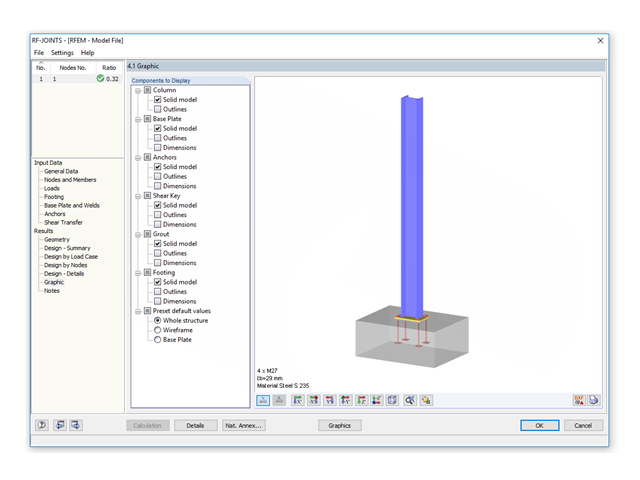
In addition to the result tables, you can create three-dimensional graphics in RF‑/FRAME‑JOINT Pro and RF‑/JOINTS. This is a realistic representation of a connection to scale.
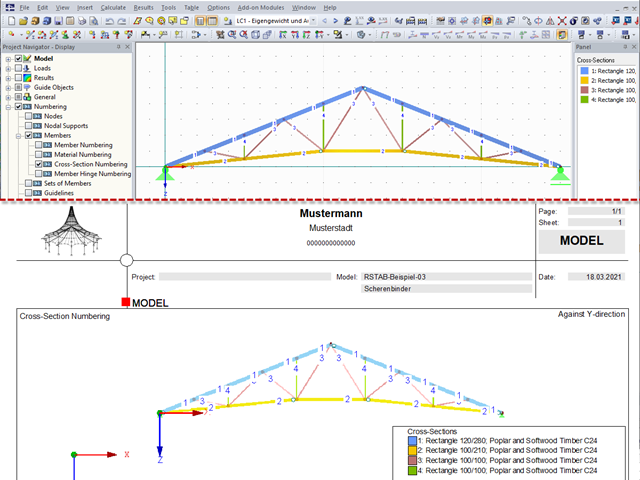
For a quick overview of the cross‑sections used, you can show the members in color sorted by cross‑section. Use the right mouse button in the work window to select "Colors in Graphics According to" → "Cross -Sections" from the shortcut menu. In the current program versions, you can use a panel with an editable color scale for this.
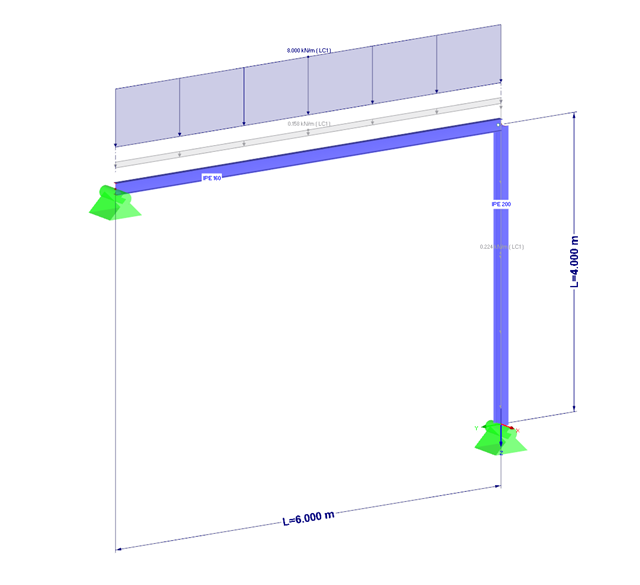
RFEM offers the following options to design a pinned end plate connection. First, there is the option in RF-JOINTS Steel - Pinned to enter the corresponding parameters quickly and easily to receive a documented analysis, including graphics. It is also possible to model such a connection individually in RFEM and then to evaluate or manually design the results. In the following example, the particularities of this modeling will be explained and the shear forces of the bolts will be compared to the corresponding results from RF-JOINTS Steel - Pinned.
![System and Loading According to [1]](/en/webimage/009455/2418877/01-en-png.png?mw=640&hash=c76563b459152b19c98197ea6ba342be89d9a5bc)
The product range of Dlubal Software contains various modules for the design of steel and timber connections. The RF-/JOINTS Steel – Column Base add-on module allows you to analyze footings of hinged or restrained steel column bases. The fastener selection, foundation geometry, and material quality are crucial for the cost-effective and safe design of the column base.
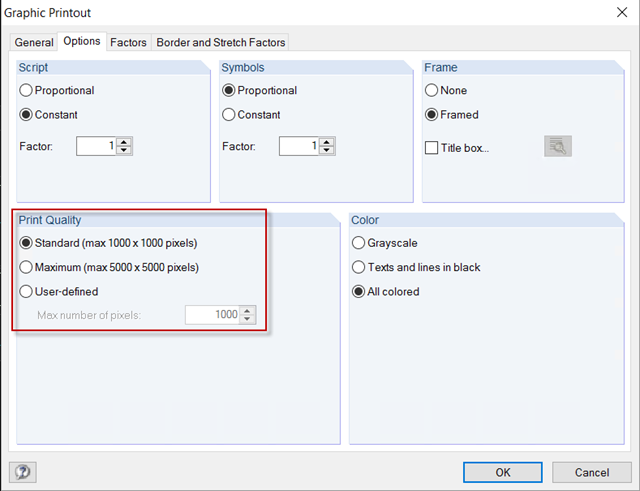
For a structural analysis printout in the usual DIN A4 page format, the default settings of 1,000 x 1,000 pixels graphic quality are completely sufficient. However, if the printout should be on a larger page format, you can increase the print quality to a maximum of 5,000 x 5,000 pixels in the Graphic Printout options, or specify a user‑defined value.
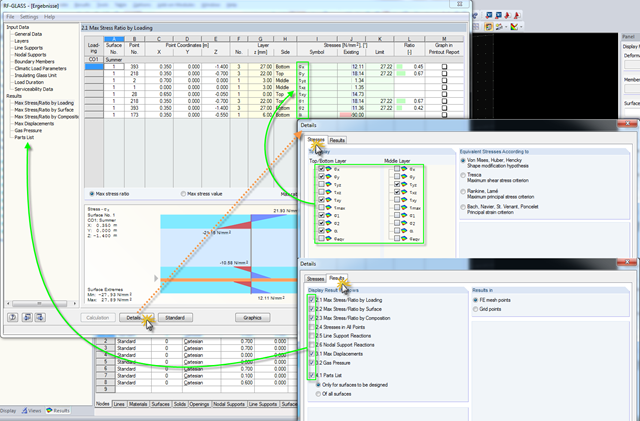
Click the [Details] button in RF-GLASS to select the results to be displayed. In order to get a better overview for the result evaluation, you can select the individual stress graphics (principal stresses, stresses oriented to axes, shear stresses) as well as various result windows. This way, you can show only the results you require.
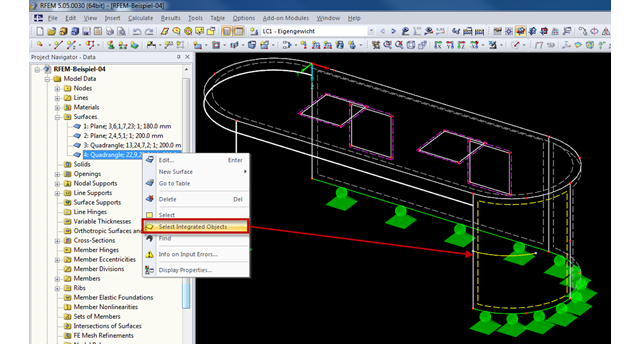
Generally, RFEM automatically detects all objects lying on a surface that are not used for surface definition. Objects integrated into surfaces can be selected using the "Select Integrated Objects" option in the shortcut menu of the relevant surface in Project Navigator. This way, you can easily find in the graphics which objects have already been integrated into a surface, for example.
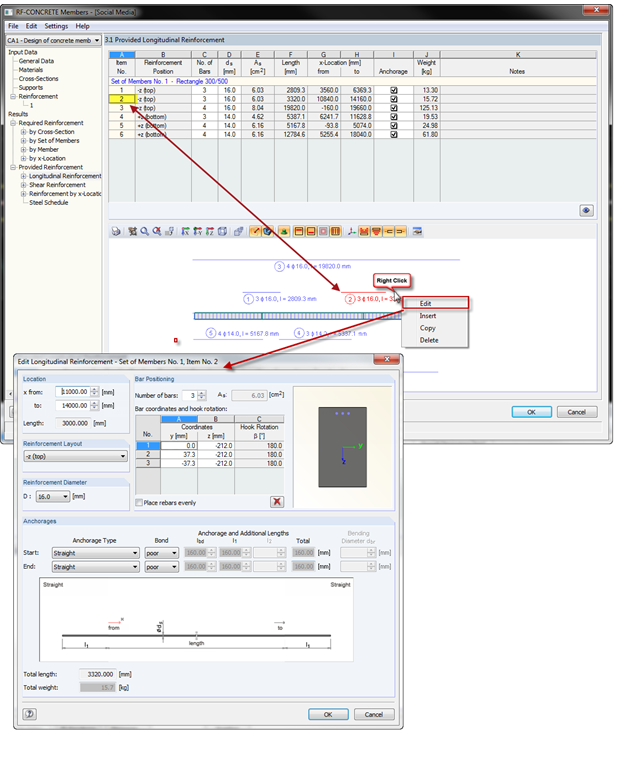
With the introduction of OSG graphics for the representation of design reinforcement in RF‑CONCRETE Members and CONCRETE, you can also select the reinforcement position directly in the graphic. Right-click the mouse to open the context menu where you can edit, copy, or delete the selected reinforcement position.
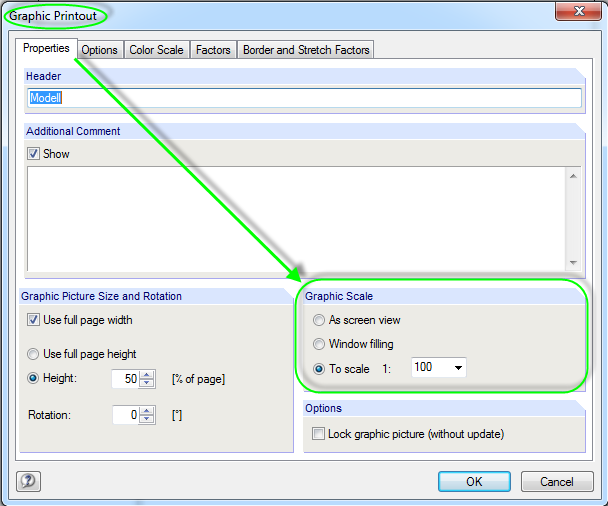
A graphical documentation of the structural analysis results facilitates the result interpretation tremendously. There are various scale options available for printing graphics in the printout report.
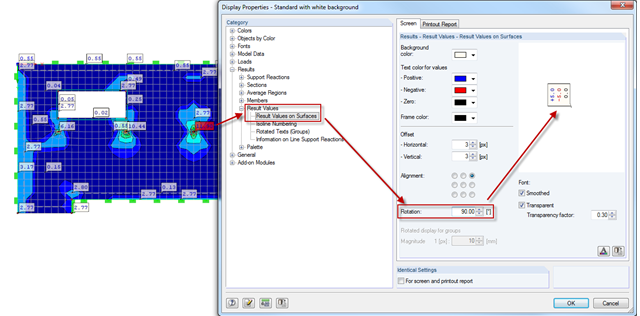
Sometimes, it is necessary to rotate graphics in the printout report. In order to also display the result values correctly, you can rotate the results by the respective angle using the Display Properties dialog box. As usual in Display Properties, this setting is to be done separately for the screen view and the printout report.
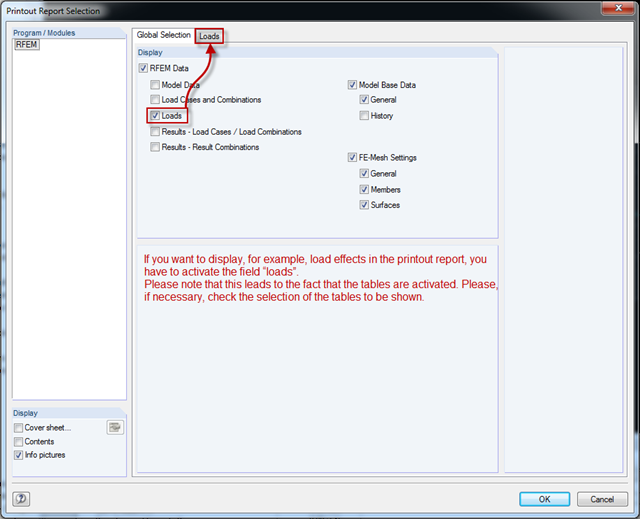
RFEM version 5.04.xx includes an adjustment when printing graphics in the printout report. In order to display graphics in the printout report, you have to select the respective check boxes in the Global Selection tab of the Printout Report Selection window (see the figure). Checking the boxes unlocks the corresponding tabs for the tables. where you can select the tables to be displayed.
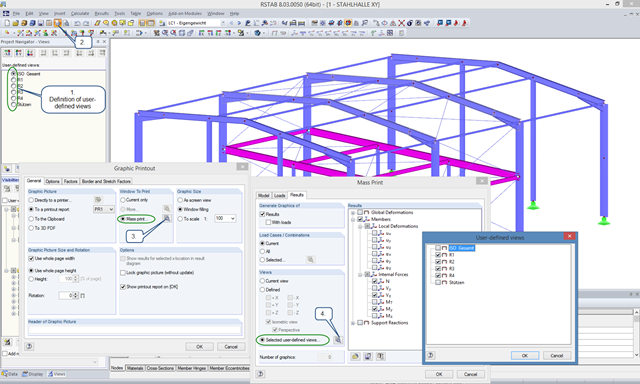
User-defined views are a very useful tool for effective modeling, as the previously selected and adapted objects appear directly with a click of the mouse. These objects can also be used easily to create informative and clearly arranged result graphics. With just a few clicks, you can create all result graphics at once using the mass print function.