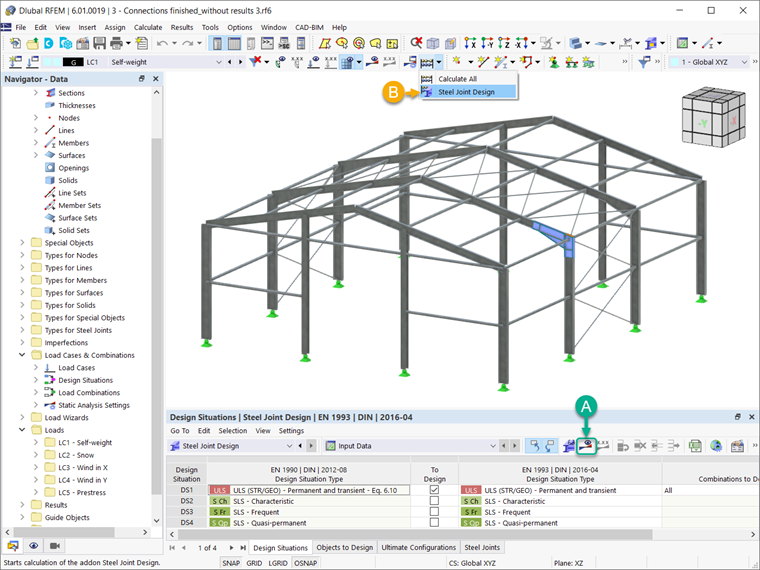
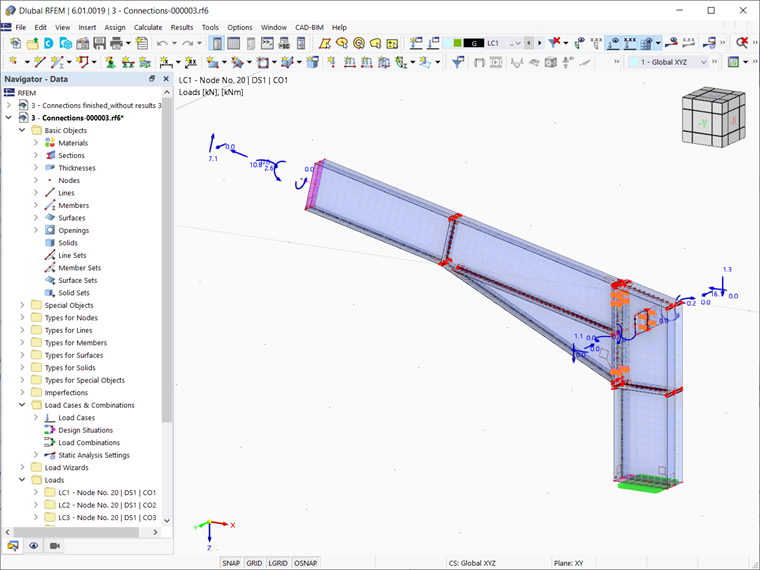
Considering that the steel connection and the associated design parameters are defined as discussed in the aforementioned articles, you can run the calculation by clicking the “Show results” button in the Steel Joints table, or via “Steel Joint Design” in the toolbar, as shown in Image 1.
Stress-Strain Analysis Results
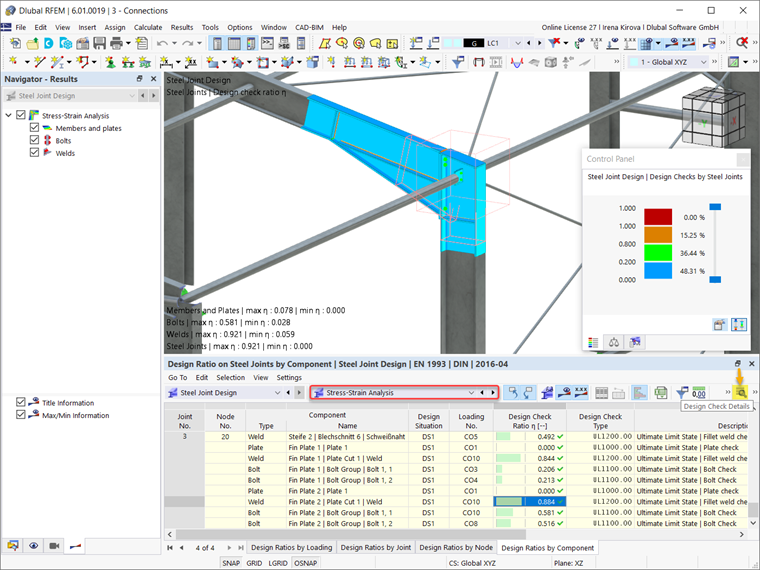
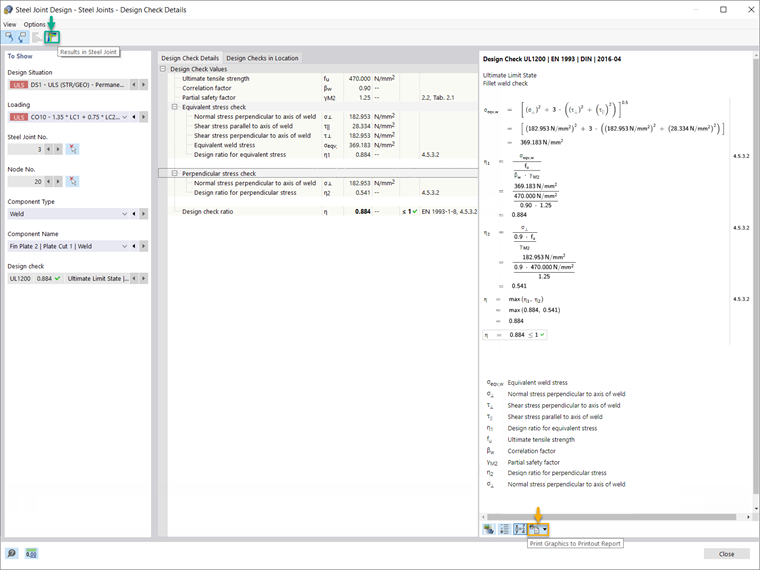
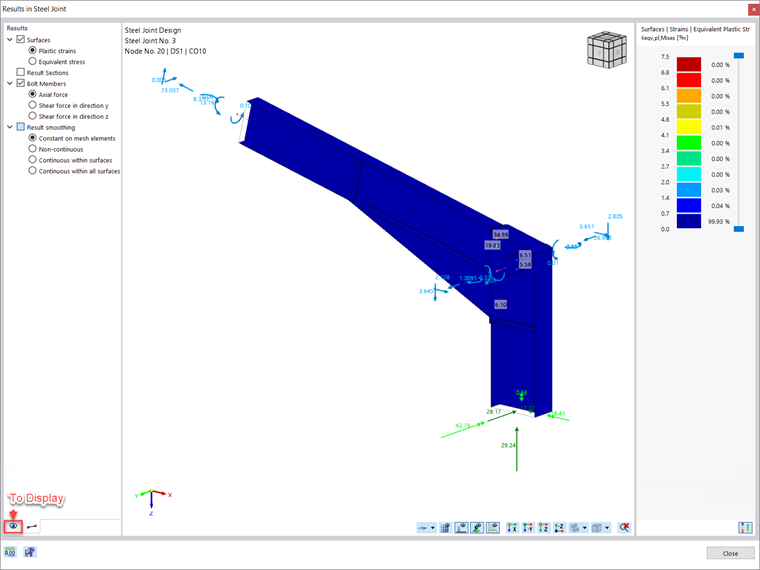
Once the calculation is finished, the results are available in the RFEM working window and the Steel Joint Design table. Image 2 shows the results of the stress-strain analysis, which can be displayed as design ratios by loading, joint, node, or component. You can display detailed design checks via the Design Check Details icon indicated in the same image.
An example of design check details is shown in Image 3. In addition to the formulas, the detailed results contain standard references, so that you can trace the design checks precisely and understand the performed verifications in detail. You can export these design check formulas and standard references directly to the printout report via the “Print Graphics to Printout Report” icon indicated in the image.
Next, you can display the results in the steel joint by clicking the associated “Results in Steel Joint” icon in the Design Check Details window (indicated in Image 3), or via the same icon in the Steel Joint Design table. Once the results are available as shown in Image 4, you can filter them according to the respective components; that is, you can display only the results for the components you are interested in. This is possible in the “To Display” section of this window.
Stability Analysis Results
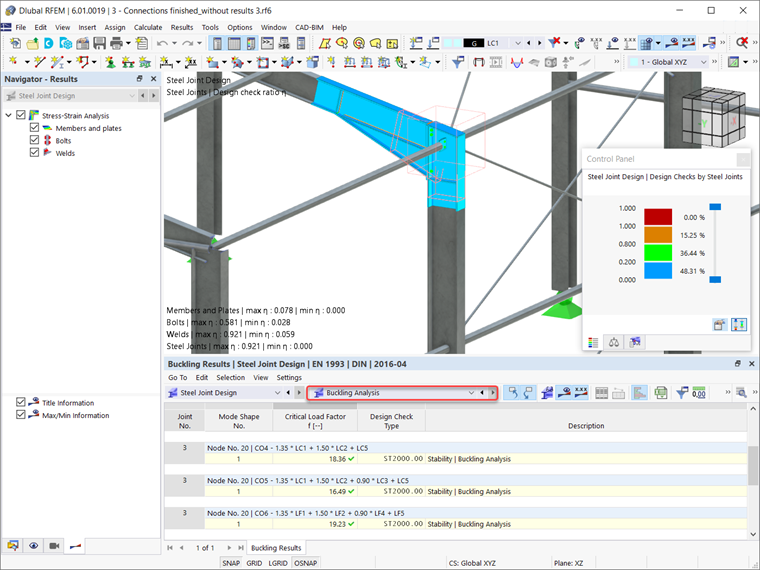
If the buckling analysis is selected in the design parameters of the ultimate configuration, you can also check whether the stability failure is relevant for the joint components (which requires the Structure Stability add-on for RFEM 6 / RSTAB 9).
Hence, the critical load factor for all analyzed load combinations and the selected number of mode shapes is calculated for the connection model and given in the Steel Joint Design table (Image 5). The smallest critical load factor is compared with the limit value 15 from the standard EN 1993-1‑1 [1], or a user-defined value. The definition of these settings can be found in Image 7 of the Knowledge Base article:
Designing Steel Joints in RFEM 6
.
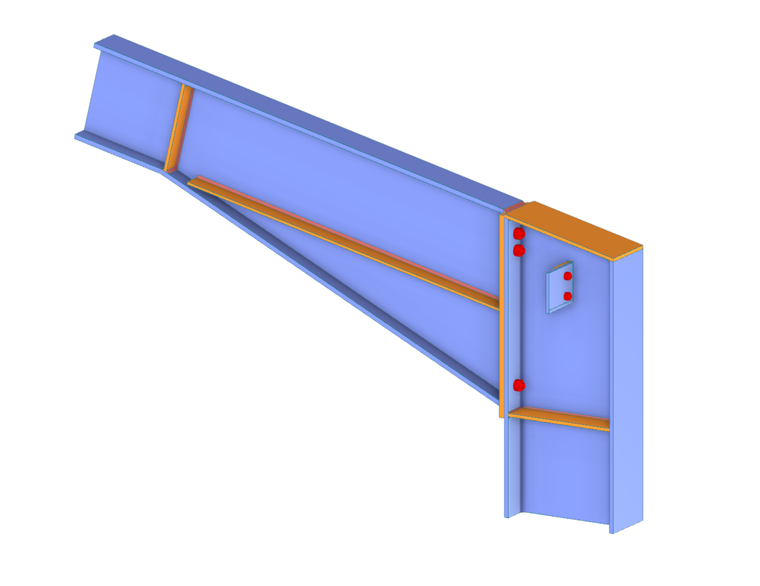
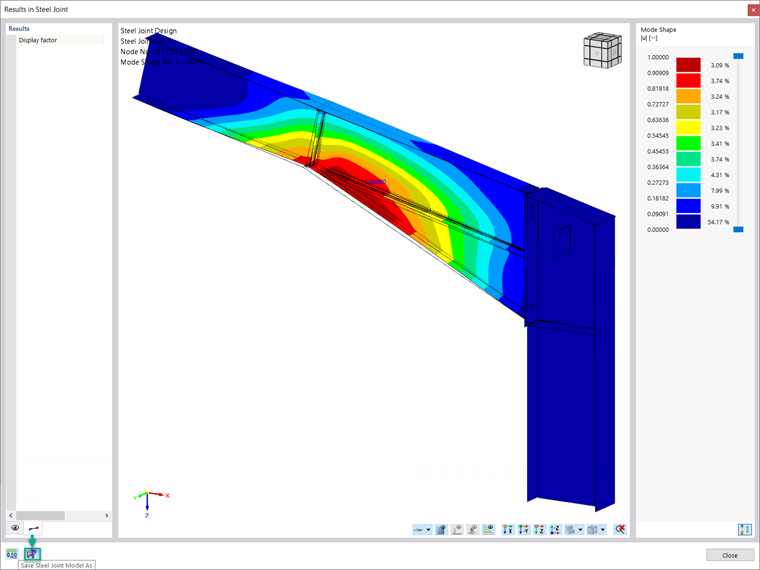
You can display the corresponding mode shapes graphically via “Results in Steel Joint”, as shown in Image 6. It is important to highlight that an adapted surface model is considered for the stability analysis to specifically recognize the local buckling shapes. Hence, the model of the analysis (including the results), can also be saved as a separate model file by clicking the “Save Model As” icon indicated in the image. This model is displayed in Image 7.
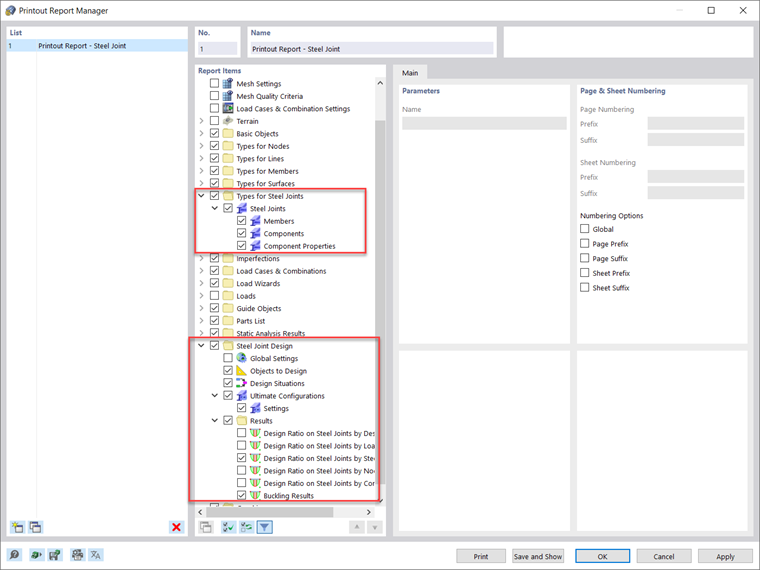
Documenting Input Data and Results
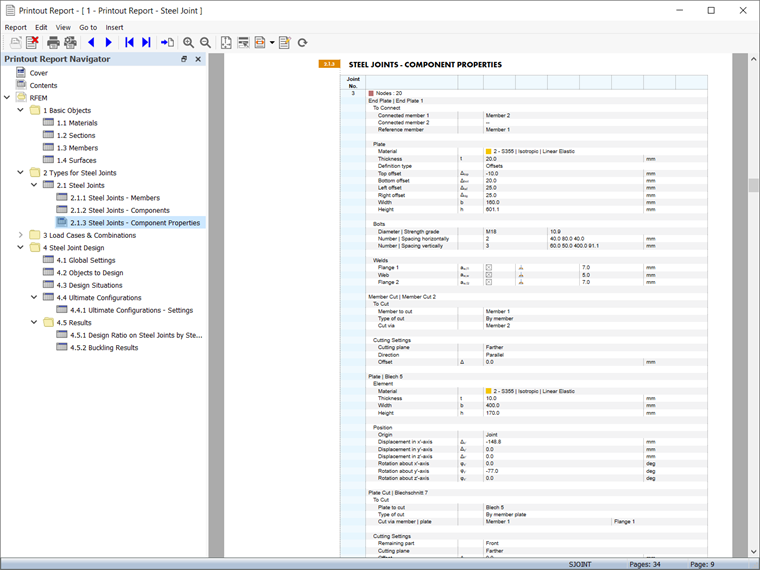
All input data and results obtained for the analysis of steel joints in RFEM 6 can be documented in a multilingual printout report. The scope of the printout can be customized via filter criteria so that you can include items associated with the steel joint design, as shown in Image 8. In this manner, you can document all data related to members, components, and components’ properties, as well as the design and analysis results in the printout report (Image 9).
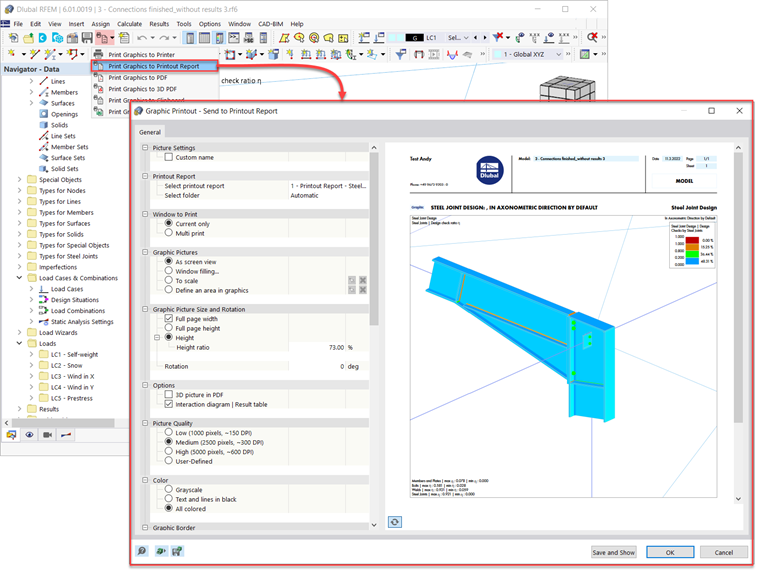
You can also include specific design check details in the printout report, as shown in Image 3. In addition, you can export graphics of the work window containing results directly to the printout report via "File → Print Graphics to Printout Report" (Image 10).
It is also possible to select the image content via a window selection in the graphic using the "Define an area in graphics" function. Next, you can adjust these graphical printouts in terms of quality, size, display settings, and so on. If you are interested in printing out multiple graphics associated with the steel joints, this is also possible using the "Multi print" function in RFEM 6.