User Story
In this example, we are going to calculate averaged force values for a bridge section, such as those applicable to structural sections in the design process based on WTG-Merkblatt-M3
According to Figure 2.2 in the WTG-Merkblatt-M3, this example is classified as Group 1.
- G2: Absolute values with medium accuracy requirements. The area of application can include parameters or preliminary studies when later investigations with higher accuracy are planned (e.g., wind tunnel examination of class G3).
- R2: Solitary, all relevant wind directions with sufficiently fine directional resolution.
- Z1: Statistical mean values, provided they concern stationary flow processes where fluctuations (e.g., due to approaching flow turbulence) can be captured sufficiently by other measures.
- S1: Static effects. It is sufficient to represent the structural model with the necessary mechanical detail, but without mass and damping properties.
The dimensions of the example are shown in Figure 1, and the input assumption is illustrated in Table 1:
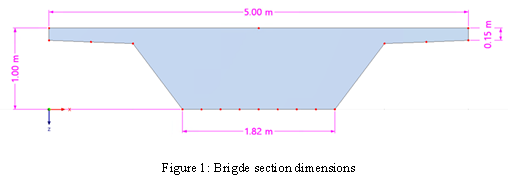
Table 1: Input Data of the Bridge Section Verification Example
| Model | Bridge Section |
|---|---|
| Basic wind speed | V = 30 m/s |
| Air density | ρ = 1.225 kg/m³ |
| Solver | Pressure-Based |
| Turbulence model | Steady k-ω SST |
| Type of wind velocity profile | Constant in height |
| Turbulence Intensity | 27% |
| Numerical algorithm | SIMPLE algorithm |
| Discretization | Second-Order |
| Residual pressure | 10⁻⁴ |
| Kinematic viscosity | ν = 1.5 × 10⁻⁵ |
Image 2 shows a mesh sensitivity study in RWIND Pro for a bridge section. The force coefficient 𝐶𝑓
decreases slightly from 0.94 at 10% mesh density to 0.90 at 25% density, then increases marginally to 0.92 at 35% density. Although there's a small fluctuation, the variation remains within an acceptable tolerance, indicating that the results are sufficiently stable for practical engineering use.

Also, the computational mesh study needs to be performed according to the following link:
In this example we will compare the average wind force value in the x-direction between EN 1991-1-4 and RWIND. The force coefficient cfx,o for bridge sections can be obtained using Figure 8.3 in EN 1991-1-4:
Force in X-Direction - Simplified Method
Where it has been assessed that a dynamic response procedure is not necessary, the wind force in the x-direction may be obtained using Expression (8.2) in EN 1991-1-4:
vb=30 m/s is the essential wind speed
C is the wind load factor. C=ce⋅cf,x=1.425×1.3=1.85 , where ce is the exposure factor given in 4.5 and cf,x is given in 8.3.1(1)
Aref,x=5 m2 is the reference area given in 8.3.1
ρ=1.225 kg/m3 is the density of the air
The WTG-Merkblatt M3 provides two key methods for validating simulation results. The Hit Rate Method evaluates how many of the simulated values Pi correctly match the reference values Oi within a defined tolerance, using a binary classification approach (hit or miss). This approach assesses the reliability of the simulation by calculating a hit rate q, similar to confidence functions used in reliability theory. In contrast, the Normalized Mean Squared Error (e2) method offers a more detailed accuracy assessment by quantifying the average squared deviation between simulated and reference values, normalized to account for scale differences. Together, these methods provide both qualitative and quantitative measures for simulation validation.
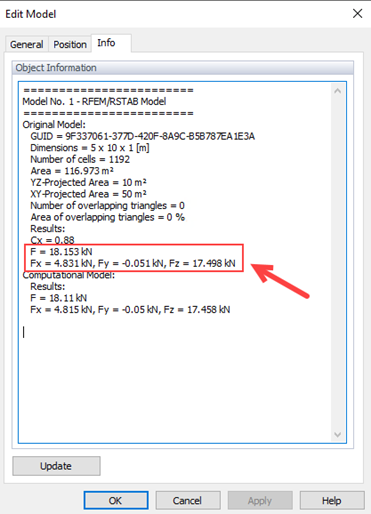
Force Results in RWIND and Comparison to Eurocode
In RWIND the results of the total wind forces are available in the Info tab of the Edit model as shown in Figures 3 and 4. The difference between the critical wind direction scenario RWIND (θ=0°) and the Eurocode is about Wrel = 5.36% (lower than the mentioned criteria in WTG = 10%); then the hit rate can be obtained as q=100%, which shows good agreement. The low normalized mean square error e2=0.002 also confirms strong agreement between simulation and measurements, meeting the validation standards effectively.