In a printout report, you can specify the data that you need for the documentation. You can also integrate graphics, explanations, scans, and PDF files in the printout report.
This chapter describes how you can create a clearly arranged printout report. First, let's take a look at how you can define your own views. They can be added into the printout report later, as images. Finally, various selected editing options for the printout report are then explained. You can find more information here:
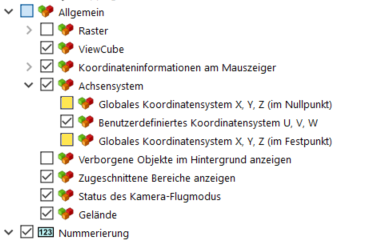
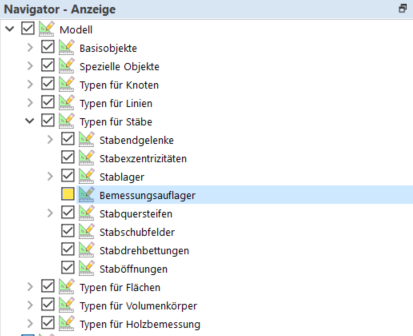
You can adjust the display in advance in order to show only the relevant objects and captions in the views. You can select which objects to display in the workspace in the navigator under
![]() . For example, deactivate the display of the original coordinate system and the design supports.
. For example, deactivate the display of the original coordinate system and the design supports.
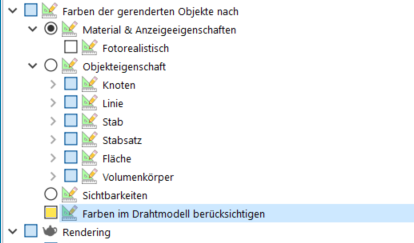
Furthermore, you can also activate the wireframe model in the toolbar using the
![]() button. In order to display the members in black, it is necessary to specify in the Navigator that the colors in the wireframe model should not be taken into account.
button. In order to display the members in black, it is necessary to specify in the Navigator that the colors in the wireframe model should not be taken into account.