Creating Printout Report
You can create a new printout report using the
![]() button in the toolbar.
button in the toolbar.
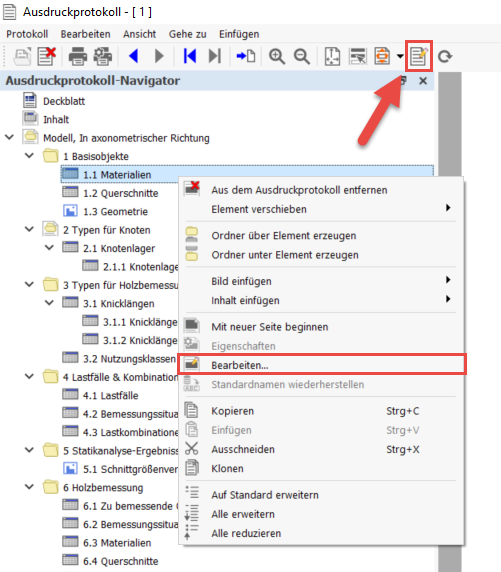
Editing in Printout Report Manager
Click "Edit" in the shortcut menu of an entry or the
![]() button in the printout report toolbar to return to the printout report manager.
button in the printout report toolbar to return to the printout report manager.
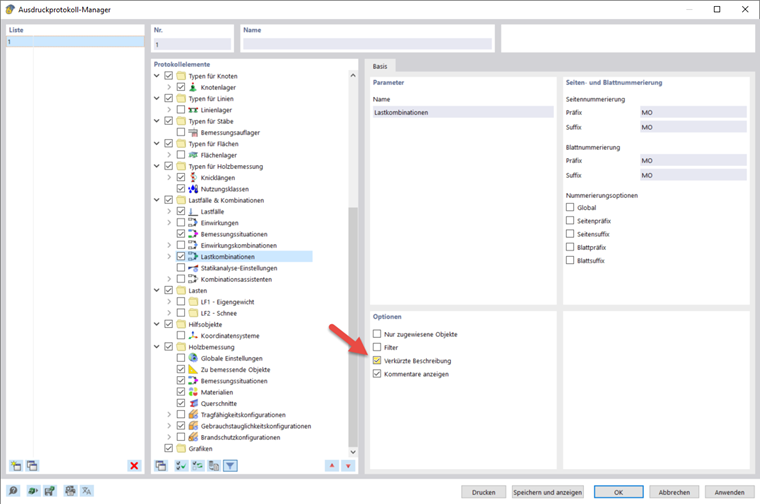
Here you can select the data to be included in the printout report. This webinar shows an example of which options can be activated as of minute 46:30. Of course, this depends on the purpose of the printout report.
There are additional options for many subitems. For example, you can activate Brief Descriptions for load cases and combinations in order to get only the most important information.
By default, the printout report is synchronized with the current table. This can be deactivated and you can make your own settings instead, in the "To Display" tab. It is also possible to transfer the results of the structural analysis to the printout report for selected load cases and combinations only. The selection is made in the tab of the same name, provided that the "Load" option has been activated beforehand.
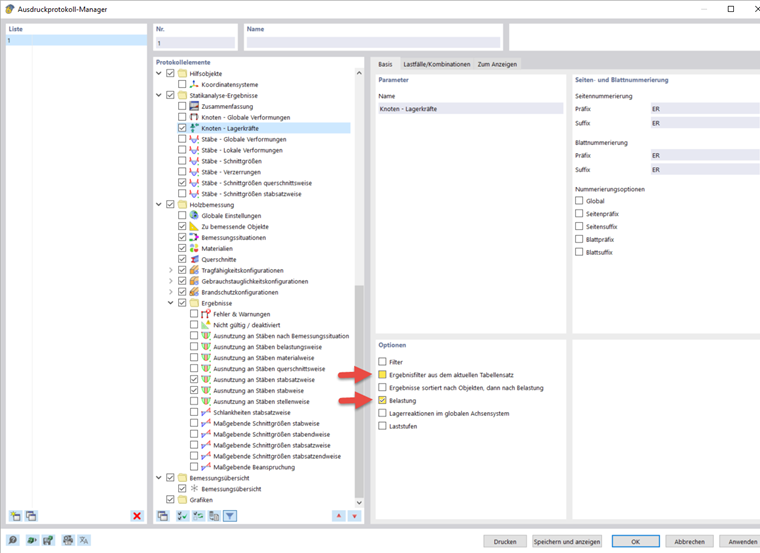
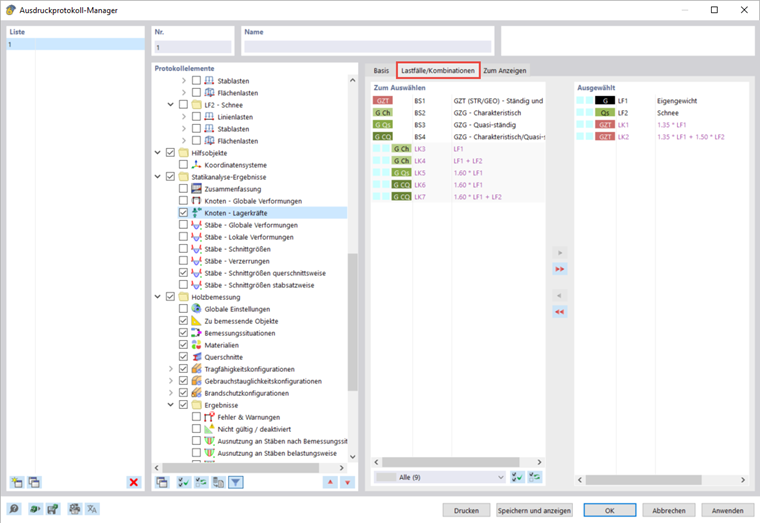
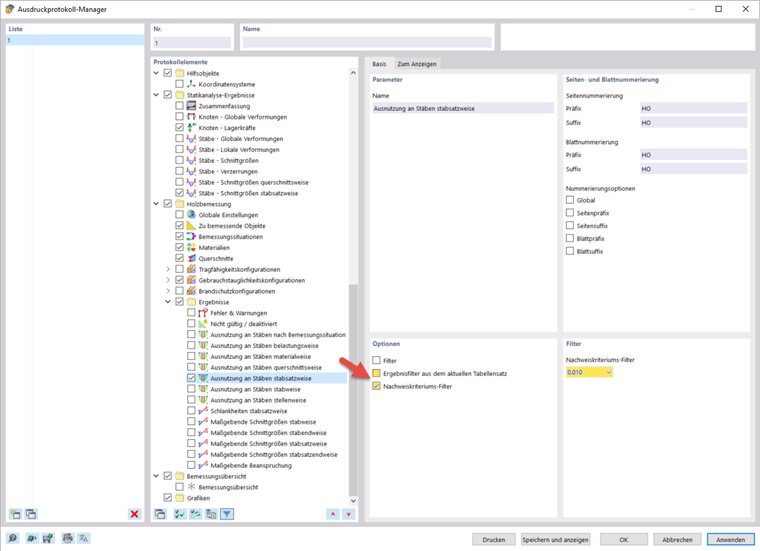
You can select a design criterion filter in the section for the timber design results. For example, you can only print out design ratios greater than 1% in the report.
Editing Images
Select "Edit" in the shortcut menu of an image to open the image view in the main workspace. Here, you can edit the view, for example, by rotating and moving it, or in the "Display" navigator tab. Right-click to confirm the changes and transfer them directly to the printout report.
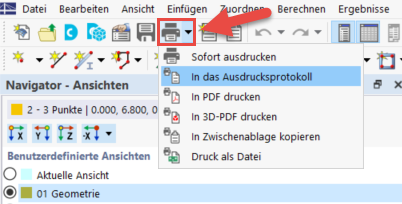
Inserting Views
You can print previously defined and current views in the printout report using the
![]() button.
button.
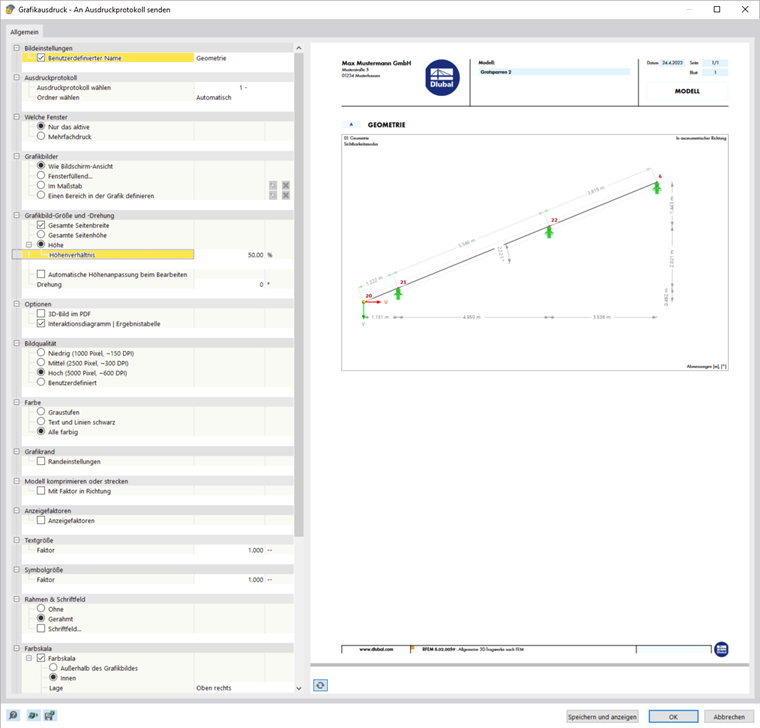
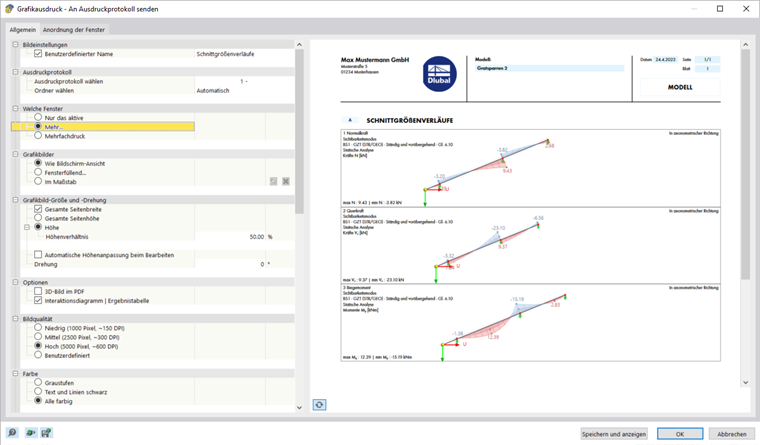
A dialog box appears where you have various options for customizing the image display. You can move the inserted images in the printout report using drag & drop.
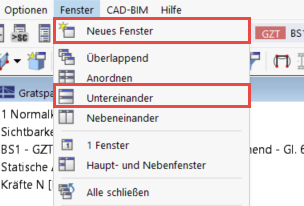
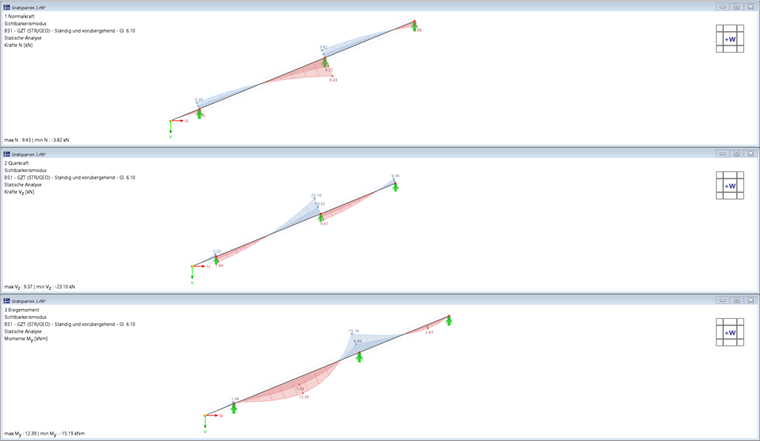
In order to print several views in the printout report - for example, the internal force distribution in the hip rafter - it is necessary to display the different views in the main program at the same time. To do this, open a new window for each view in the menu bar under "Window" and arrange them in the desired form. By clicking on it, you select a window and can work in it as usual. The other windows remain unchanged. You can open various views for the internal forces in several windows.
In the editing dialog box for the graphic print, activate the option of inserting the views of several windows in order to print the views in this order in the printout report.
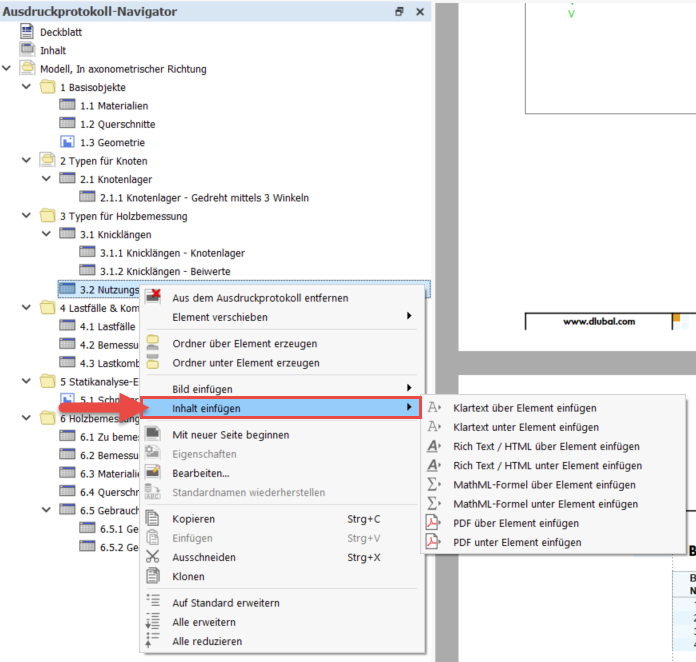
Inserting Text and Files
You can integrate external graphics, text, or formulas into the printout report by selecting the "Insert Content" option in the shortcut menu of an element. Plain text is suitable for short comments with simple formatting, Rich Text / HTML allows for integrating the formatted text files including embedded graphics into the printout report, and MathML Formula allows you to insert formulas as an HTML code in MathML or a LaTeX format. It is also possible to integrate PDF documents into the printout report.