User Story
This example presents experimental and numerical data for aerodynamic forces acting on bridge deck cross-sections [1]. Such data are widely used as benchmark references for validating CFD simulations and for assessing aeroelastic behavior in wind engineering applications. Flow around bridge cross-sections represents a complex aerodynamic problem involving flow separation, shear layer interaction, and wake development. Depending on the geometry and angle of attack, both steady and unsteady aerodynamic effects can occur, including vortex shedding, galloping, and flutter.
Compared to simple bluff bodies, bridge decks exhibit highly geometry-dependent flow behavior. Small geometric details (e.g., edge sharpness, railings, fairings) can significantly influence pressure distribution and force coefficients. Therefore, accurate prediction of these effects is particularly challenging for numerical simulations. This example is fundamentally related to Group 4, as it addresses aeroelastic phenomena, particularly flutter and fluid–structure interaction (FSI) behavior of bridge cross-sections. However, since a fully coupled two-way FSI simulation is currently not available in RWIND, a direct representation of aeroelastic effects is not feasible.
Therefore, a simplified approach is adopted. Consequently, this example is treated in RWIND as belonging to Group 1, according to Figure 2.2 in WTG-Merkblatt M3, based on the evaluation of the mean wind velocity and corresponding averaged aerodynamic quantities:
- G1: Qualitative values with low accuracy requirements for use in the basic investigation or preliminary design. The effort and the requirements for the level of detail are reduced, as often not all boundary conditions are fully clarified.
- R1: Solitary (without surrounding buildings), analysis of individual important wind directions.
- Z1: Statistical mean values, provided these concern stationary flow processes where fluctuations (e.g., due to approaching flow turbulence) can be sufficiently captured by other measures.
- S1: Static effects. It is sufficient to represent the structural model with the necessary mechanical detail, but without mass and damping properties.
Description
The investigated case focuses on the aerodynamic behavior of a bridge deck cross-section subjected to steady incoming flow at different angles of attack. The main objective of this study is to determine the stationary aerodynamic force coefficients, with particular emphasis on the drag coefficient CD. Based on steady-state CFD simulations, the mean drag force acting on the cross-section is evaluated and subsequently non-dimensionalized using the reference dynamic pressure and characteristic dimensions. This allows the calculation of CD and enables a consistent comparison with experimental data as well as its application in structural design.
In addition to the drag coefficient, other global coefficients such as lift CL and moment CM may also be assessed to provide a more complete aerodynamic characterization of the bridge deck. However, the primary focus remains on the accurate prediction of CD as a key parameter for along-wind loading.
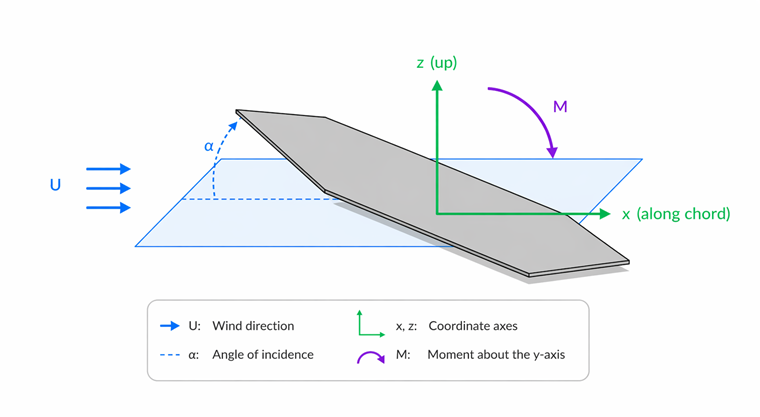
The starting point is the dynamic pressure of the wind, defined as qo=1/2 ρU2, where ρ is the air density and U is the mean wind velocity. This quantity represents the kinetic energy of the airflow per unit volume and serves as the reference for all aerodynamic loads.
Table 1: Input data of the bridge sections
| Parameter | Symbol | Value | Unit |
|---|---|---|---|
| Free Stream Velocity | u | 8.2 | m/s |
| Roof Height | Href | 180 | mm |
| Air Density – RWIND | ρ | 1.25 | kg/m³ |
| Turbulence Model – RWIND | RANS K-Omega | - | - |
| Kinematic Viscosity – RWIND | ν | 1.5×10⁻⁵ | m²/s |
| Scheme Order – RWIND | Second | - | - |
| Residual Target Value – RWIND | 10⁻⁴ | - | - |
| Residual Type – RWIND | Pressure | - | - |
| Minimum Number of Iterations – RWIND | 800 | - | - |
| Boundary Layer – RWIND | NL | 10 | - |
| Type of Wall Function – RWIND | Standard | - | - |
Computational Mesh Study
Figure 2 presents a mesh sensitivity analysis of a cylindrical model in RWIND. The calculated force coefficient (Cf) decreases slightly from 0.76 at a mesh density of 15% to 0.71 at 25%, and further to 0.70 at 35%. This gradual reduction indicates that the solution is stabilizing as the mesh is refined. The small variation in Cf at higher mesh densities demonstrates overall convergence, suggesting that further refinement has only a minor impact on the results.
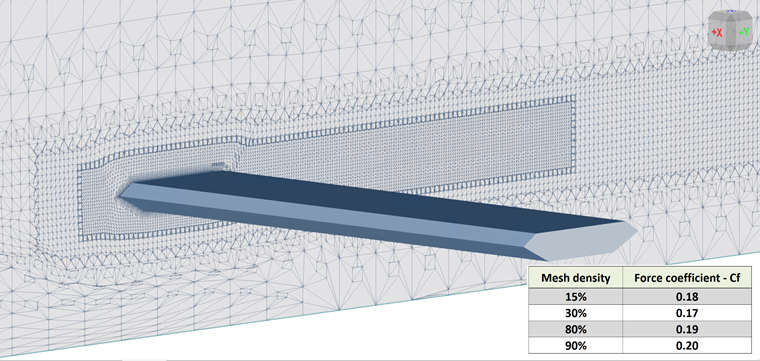
Also, the computational mesh study needs to be performed according to the following link:
WTG-Merkblatt M3 Accuracy Requirement
The WTG-Merkblatt M3 provides two key methods for validating simulation results. The Hit Rate Method evaluates how many of the simulated values Pi correctly match the reference values Oi within a defined tolerance, using a binary classification approach (hit or miss). This approach assesses the reliability of the simulation by calculating a hit rate q, similar to confidence functions used in reliability theory. In contrast, the Normalized Mean Squared Error (e2) method offers a more detailed accuracy assessment by quantifying the average squared deviation between simulated and reference values, normalized to account for scale differences. Together, these methods provide both qualitative and quantitative measures for simulation validation.
Results and Discussion
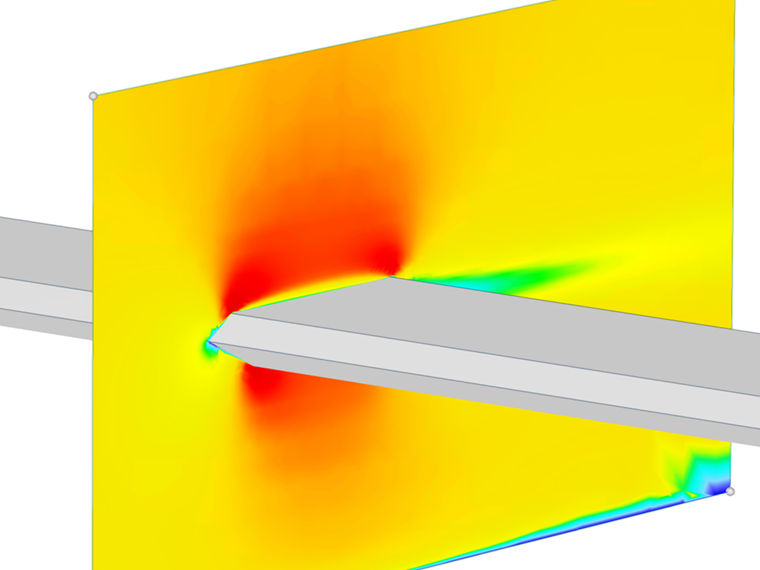
Figure 3 illustrates the surface pressure distribution and integrated aerodynamic forces on a two-dimensional square plate. The simulation is performed with a free-stream velocity of 8.2 m/s, and the pressure contours range from +32.1 Pa to −45.4 Pa, highlighting regions of positive pressure and suction. The information window compares the results of the original CAD geometry with those of the computational model, reporting a resultant force of 4.8 N together with its force components and the corresponding center of pressure. This example demonstrates RWIND's capability to accurately compute pressure distributions, integrate aerodynamic loads, and determine the center of pressure for validation and structural load transfer purposes.The integrated aerodynamic loads obtained from the computational model result in a total force of 4.8 N, including a drag force of 2.0 N, which is used to calculate a drag coefficient of CD = 0.073 based on a reference area of 0.648 m². In addition, the computed center of pressure provides the location of the resultant aerodynamic force acting on the model. Together, these results demonstrate the consistency of the pressure distribution, integrated force calculation, and aerodynamic coefficient evaluation used for validation purposes.
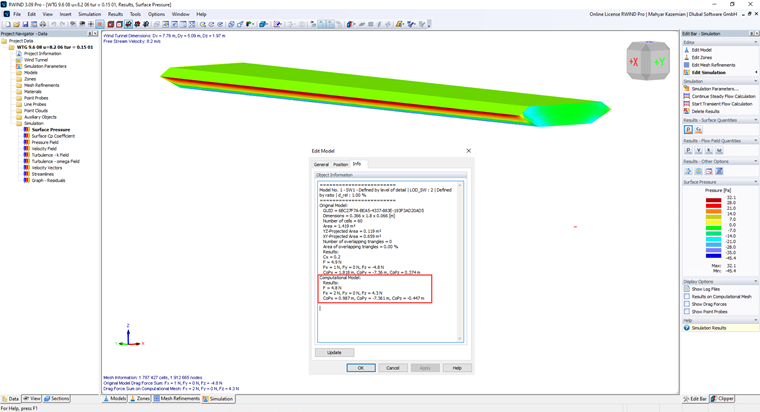
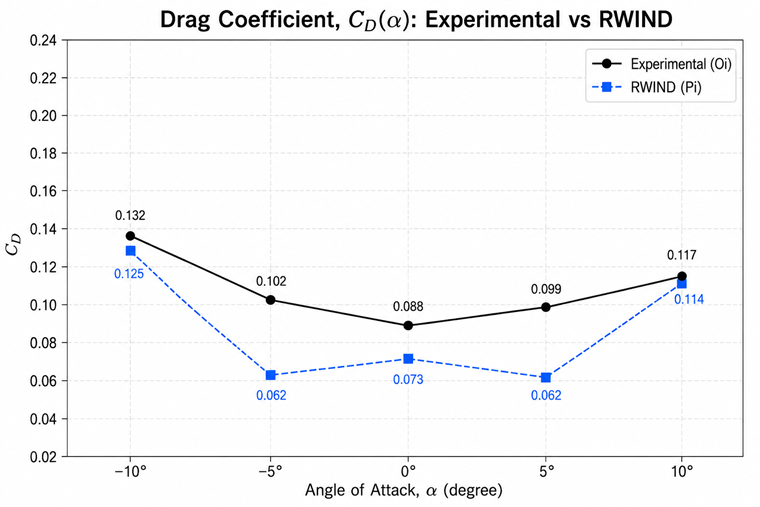
Table 2 compares the drag coefficients obtained from the experimental measurements and RWIND for five angles of attack. For each case, the absolute difference (Pi − Oi), percentage deviation, and compliance with the ±10% and ±20% acceptance criteria are reported. The results show excellent agreement at −10° and 10°, with deviations of 5.30% and 2.56%, respectively. Larger discrepancies are observed at −5° and 5°, while the 0° case remains within the ±20% acceptance criterion. Overall, 40% of the cases satisfy the ±10% criterion, whereas 60% satisfy the ±20% criterion.
Table 2: Comparison of Drag Coefficient (CD) Between RWIND and Experimental Data
| Degree | CD – Experimental (Oi) | CD – RWIND (Pi) | Pi-Oi | Deviation (%) | Hit rate ≤10% | Hit rate ≤20% |
|---|---|---|---|---|---|---|
| -10 | 0.132 | 0.125 | -0.007 | 5.30 | 🟢 | 🟢 |
| -5 | 0.102 | 0.062 | -0.040 | 39.22 | 🔴 | 🔴 |
| 0 | 0.088 | 0.073 | -0.015 | 17.05 | 🔴 | 🟢 |
| 5 | 0.099 | 0.062 | -0.037 | 37.37 | 🔴 | 🔴 |
| 10 | 0.117 | 0.114 | -0.003 | 2.56 | 🟢 | 🟢 |
Table 3 summarizes the statistical indicators used to evaluate the agreement between RWIND predictions and the experimental reference data. The validation is based on 5 data points, resulting in a Hit Rate of 40% within ±10% deviation and 60% within ±20%. The overall prediction error is quantified by a Normalized Mean Squared Error (NMSE) of 0.00093, a Mean Error (ME) of −0.0204, indicating a slight overall underestimation by RWIND, a Mean Absolute Error (MAE) of 0.0204, and a Root Mean Squared Error (RMSE) of 0.0254. These metrics provide an overall assessment of the predictive accuracy and bias of the CFD model relative to the experimental measurements.
Table 3. Statistical Performance Metrics of the RWIND Validation
| Metric | Value |
|---|---|
| Number of Data Points (N) | 5 |
| Hit Rate (10%) | 40% |
| Hit Rate (20%) | 60% |
| Normalized Mean Squared Error, e² | 0.0551 |
| Mean Error (ME) | -0.0204 |
| Mean Absolute Error (MAE) | 0.0204 |
| Root Mean Squared Error (RMSE) | 0.0254 |
Figure 4 compares the drag coefficient (CD) obtained from experimental measurements and RWIND simulations for angles of attack between −10° and +10°. Both datasets exhibit a similar U-shaped trend, with the minimum drag occurring at 0°. RWIND successfully captures the overall aerodynamic behavior but consistently underestimates the drag coefficient, particularly at the intermediate angles (±5°), while showing good agreement at the extreme angles (±10°). Overall, the results indicate that RWIND reliably predicts the qualitative trend of drag variation with angle of attack, although further improvements in turbulence and near-wall modeling could enhance its quantitative accuracy.