


In the Navigator category Designs, you can specify which designs with the respective utilizations are displayed on the designed objects. You can display the envelope of all design types or the utilizations separated by limit state and design type.
Utilization of the Envelope
At each location of the designed object, the maximum utilizations from all designs are displayed. Since all design types and limit states are combined, the result diagrams are usually not continuous.
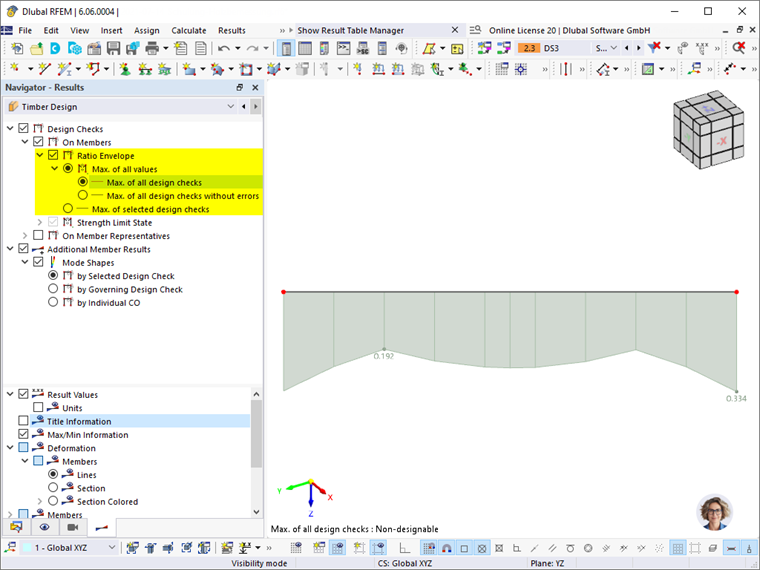
The envelope is suitable for quickly gaining and documenting a general overview of the utilization of the various objects. Errors in the display of the designs can be ignored if the entirety of the valid designs is to be displayed. For this, you can also use the 'Max. of all designs without errors' option.
If only certain designs are to be considered for the envelope, activate the 'Max. of all selected designs' option. You can then select the relevant design types.
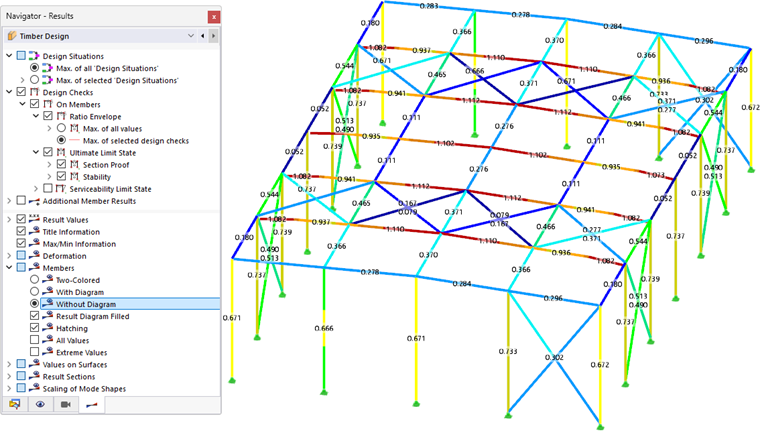
For an overview of critical areas in a frame structure, the display type Without diagram is recommended. The utilizations are displayed by colored lines according to the color scale in the Control Panel. You can use this option when the envelope or a single result type is displayed.
Utilization by Limit States and Design Type
The results can be displayed specifically for each limit state (ultimate, serviceability, fire resistance) with the individual design types (cross-section check, stability, etc.).
For members, the maximum utilization of the results for the selected design types is displayed at each location. With this option, you can read which design type is governing at a specific location.
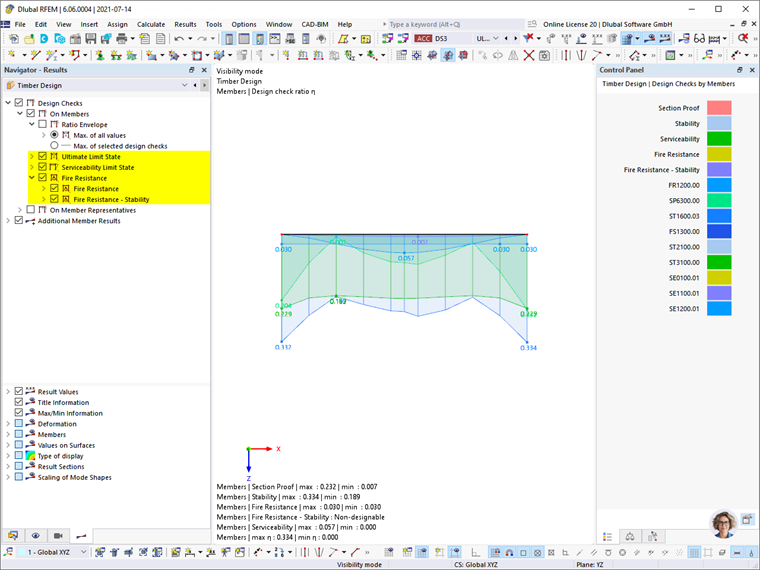
The selected results are displayed simultaneously on the model (see also image Displaying several result types). In the control panel, you can read the colors of the design types and adjust them if necessary (see chapter Control Panel of the RFEM manual).
For surfaces, the utilizations are displayed as isosurfaces.
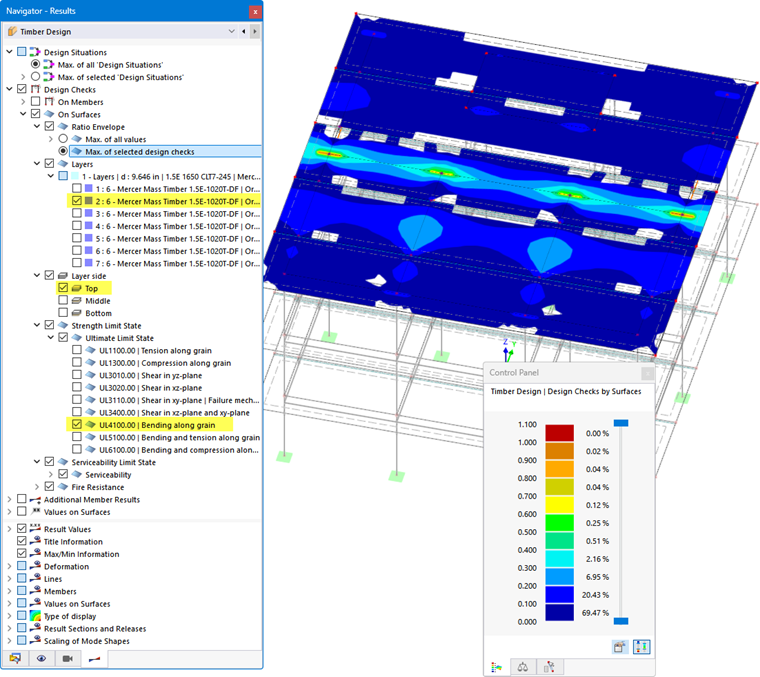
You can also select the layer side whose results are to be displayed:
- Top
- Middle
- Bottom
The following applies: If the local z-axis is oriented downwards in the Model Base Data, the top side is on the surface side in the direction of the negative surface z-axis (−z), and the bottom side accordingly in the direction of the positive z-axis (+z). If the local z-axis is oriented upwards in the Base Data, this definition is reversed.