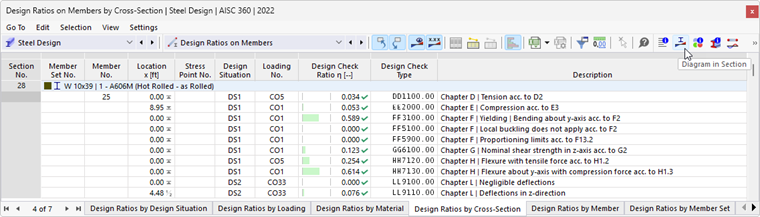
The result diagrams in cross-section display the results at the stress points of the cross-section. To open this display, click the
 button. It is available in the result tables of the 'Timber Design' category for member objects, but not for surfaces.
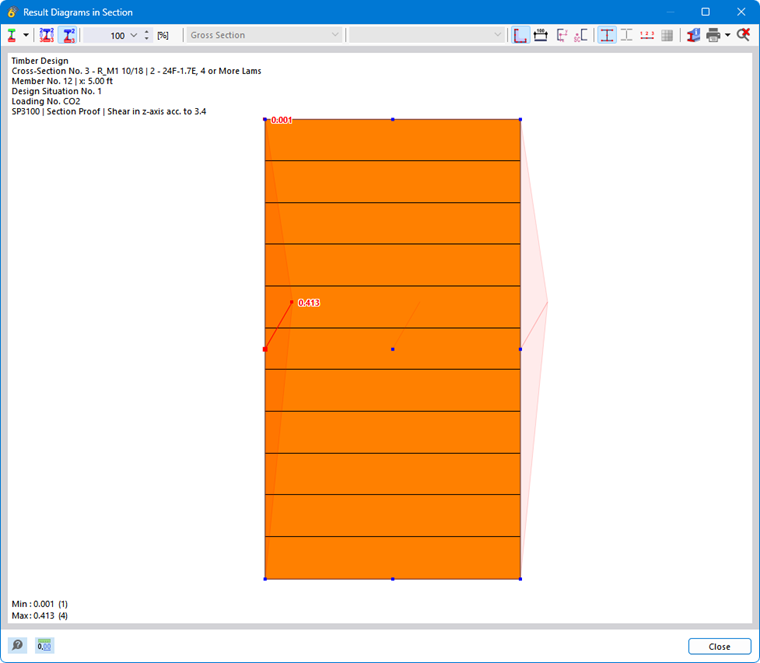
The 'Result Diagrams in Cross-Section' window appears. The graphic shows the stress state existing for the result of the current table row.
You can control the graphic as usual with the mouse, for example, to zoom. The functions are described in the Graphic Control chapter of the RFEM manual.
The result display can also be adjusted using the buttons in the toolbar. They have the following functions:
| Button | Function |
|---|---|

|
List button with selection option for result types |

|
Shows or hides the values at the stress points |

|
Shows only the extreme values of positive and negative results |

|
Allows you to scale the result diagrams by a factor in [%] |

|
Shows or hides the cross-section contour |

|
Shows or hides the dimensioning |

|
Shows or hides the axis system |

|
Shows or hides the shear center |

|
Shows or hides the stress points |

|
Shows or hides the numbering of stress points |

|
Shows or hides the FE mesh |

|
Opens the 'Cross-Section Info' window |

|
Allows you to print the current display |

|
Shows the full view of the result diagrams |
Result types
Using the list button
, you can select which results are to be displayed on the cross-section. Depending on the design, the following options are available:
- Utilization diagram
- Stresses
- Unit stresses
- Strains
- Unit strains
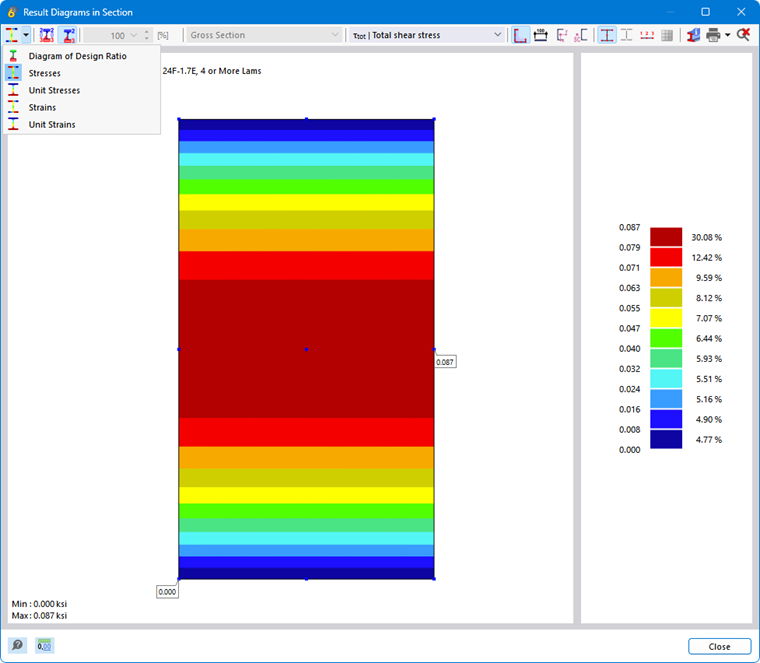
Depending on the existing loading, you can display various results on the cross-section. Use the selection options in the menu bar for this.
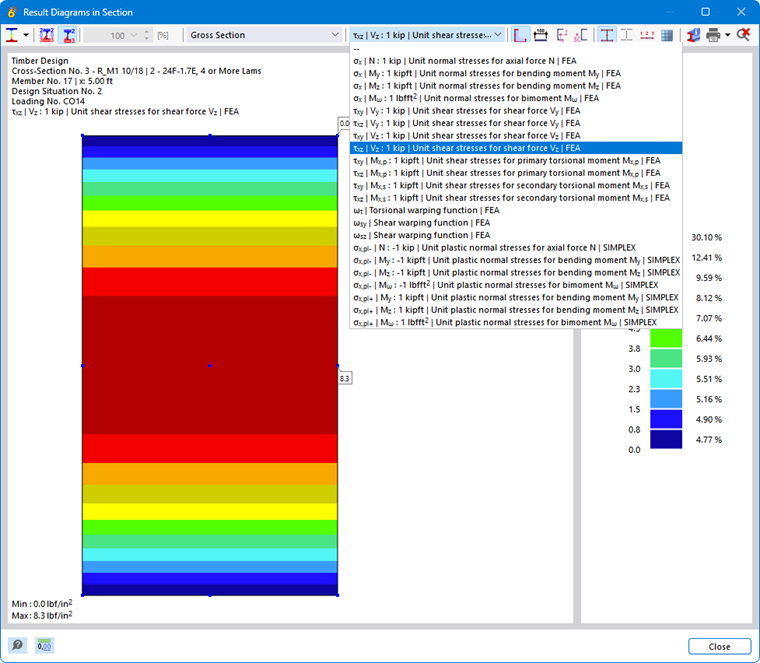
For the unit stresses, the designation FEM stands for a result from a finite element analysis, while Simplex stands for a cross-section calculation according to the Simplex method. The results are displayed directly on the cross-section as color gradients.
Graphic printout
With the options of the list button
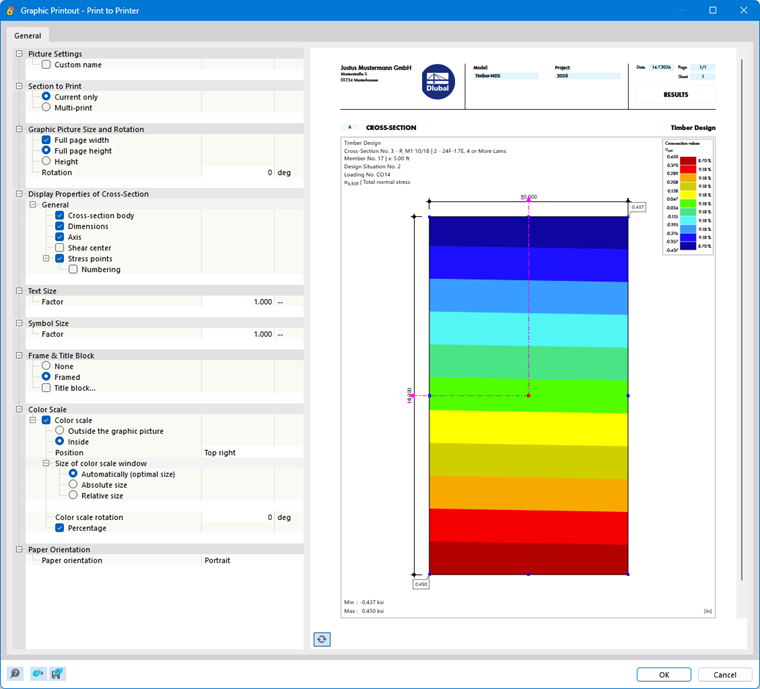
, you can directly print the current graphic, save it as a PDF, or transfer it to the printout report. The details to be displayed can also be defined in the print preview.